Chapter 2 Data
The data used to develop prognostic models was derived from the Childhood Cancer Survivor Study (CCSS), a retrospective cohort focused on the late effects of cancer treatments among CCSs. In this chapter, I first introduced the data source (sections 2.1 and 2.2) and then prepared the data including assigning age at event/censoring for each participant (section 2.3) and applying exclusion criteria (section 2.4). Finally, I conducted exploratory data analysis (sections 2.5, 2.6, and 2.7).
2.1 Data source: The Childhood Cancer Survivor Study
The Childhood Cancer Survivor Study (CCSS) is a multi-institutional collaborative project which assembled a large and diverse cohort of childhood cancer survivors in North America, enabling investigators to study the relationship between late effects after cancer therapy and treatments.
Establishment and follow-up of the CCSS cohort
Details about the establishment and follow-up of the cohort have been documented in (Robison et al. 2002, 2009) and Leisenring et al. (2009). Briefly, patients were eligible for recruitment if they were 5-year survivors diagnosed before age 21 with one of the following cancer types: leukemia, central nervous system (CNS) cancers, Hodgkin lymphoma, non-Hodgkin lymphoma, neuroblastoma, soft-tissue sarcoma, kidney cancer, or bone tumors.(Robison et al. 2002) Recruitment of the original cohort began in 1992.(Leisenring et al. 2009; Armstrong et al. 2016) Investigators identified 20,720 eligible survivors diagnosed between January 1, 1970, and December 31, 1986. After extensive tracing and contacting efforts, 69% (14,357) of the eligible study population completed the baseline questionnaire.(Leisenring et al. 2009) The demographic and cancer-related characteristics of participants, non-participants, and those who were lost to follow-up were compared in Robison et al. (2002) and no statistically significant differences were found. From 2008, CCSS started to expand the original cohort by recruiting eligible survivors diagnosed between January 1, 1987, and December 31, 1999 (Robison et al. 2009). At last, the CCSS cohort was expanded to 38,036 eligible survivors with 25,665 participating (“Overall CCSS Cohort Demographic and Treatment Exposure Tables” n.d.).
To monitor the health conditions and late effects among the established cohort, five follow-up surveys had been sent out prior to the time we received the CCSS data. Among the two baseline questionnaires and five follow-up surveys (shown in Figure 2.1), four questionnaires contained questions related to menstrual history (MH). The relevant questions were appended in Appendix A.
![Timeline of CCSS baselines and follow-up surveys [@noauthor_childhood_2013]](_figures/chapter2_survey_timeline.png)
Figure 2.1: Timeline of CCSS baselines and follow-up surveys (“Childhood Cancer Survivor Study - 2013 Progress Report” 2013)
To enable researchers to study the effects of cancer treatments, data management staffs were trained to abstract chemotherapy, radiation therapy, and surgery information from medical records by using a standardized medical records abstraction form.(Leisenring et al. 2009) Potential outliers were returned to the data management staff to double-check the medical records and verify data.(Leisenring et al. 2009)
Initial information about second malignant neoplasms (SMN) was obtained from self-reported baseline questionnaires. Then those reported positive responses were considered had possible SMNs and their information was forwarded to the CCSS Pathology Center for verification.(Neglia et al. 2001) Treatment data about the SMN was not available in this study.
2.2 Relevant data elements
To develop risk prediction models for POI in CCSs, we used information from 11,336 female survivors in CCSS, including MH information (such as age at menarche, age at last menstrual period, etc) abstracted from CCSS baseline and follow-up questionnaires that were completed between November 3, 1992, and November 25, 2016 (Mostoufi-Moab et al. 2016), and information abstracted from medical charts recorded between January 1, 1970, and December 31, 2004 (Clark et al. 2020). The treatment exposure information was restricted to within 5 years of a primary cancer diagnosis. The maximum radiation doses to body regions were obtained by summing the prescribed dose from all overlapping fields in each of the respective regions. The average radiation doses to right and left ovaries were estimated separately and the lower/higher dose was recorded as minimum/maximum ovarian radiation dose accordingly. For 22 chemotherapeutic agents, the quantitative dose as well as a yes/no evaluation of exposure was abstracted. Ten widely used alkylating agents were summed to be a cumulative alkylating drug dose according to the cyclophosphamide-equivalence dose equation recorded in Green et al. (2014).
2.3 Outcome variables
2.3.1 Definition of outcome
The outcome was whether a childhood cancer survivor experienced POI before a prespecified age. It was determined by the cut-off age, menstrual status, and age at the event. For example, if age 25 is the age of interest (i.e. the cut-off age), the outcome is “Yes” (or labeled as 1) when the individual experienced POI before age 25, and the outcome is “No” (or labeled as 0) if her menstrual function was normal at age 25 regardless of her menstrual status after this age. Censoring occurred when the menstrual status was normal but the age at last follow-up was below age 25, as menstrual status at age 25 was unknown. Surgical premature menopause (SPM) which refers to premature menopause caused by surgical interventions such as bilateral oophorectomy was considered a competing risk of POI. The outcome was labeled as 2 when an individual experienced SPM before 25. Also, when a survivor with normal menstrual function was diagnosed with an SMN before age 25, she was deemed to be censored at age of SMN diagnosis because the treatment information of SMN was not available.
2.3.2 Ovarian status
Based on the MH information, ovarian status was assigned to CCSS participants by endocrinologists according to the established definition of ovarian status (Mostoufi-Moab et al. 2016). The four possible outcomes were AOF, NSPM, SPM, and normal. AOF was assigned when a female survivor reported never experiencing menarche or permanently ceased having menses within 5 years of her cancer diagnosis (Chemaitilly et al. 2006). NSPM was assigned when menopause, which is not related to surgical, occurred before age 40 years but after 5 years from diagnosis (Levine et al. 2018). SPM was assigned when premature menopause was induced by hysterectomy or bilateral oophorectomy. Normal means that before age 40 or at the time of the last survey containing questions related to MH, neither of the above health conditions happened to the survivor.
In this analysis, AOF and NSPM were merged to POI which was the event of interest. SPM was the competing risk of POI.
2.3.3 Deriving age at event
Assigning age at event for individuals was not straight forward because different information, including age at menarche, age at last menstrual period, age at a most recent survey that contains MH information, age at surgical ovary removal, and age at SMN, need to be considered simultaneously. The details of deriving age at event were given in Appendix B. The algorithms for deriving it have been discussed with endocrinologists to ensure its rationality. Typically, for NSPM, age at event was from self-reported age at last menstrual period. For SPM, the age at surgical time was used. For AOF, age at last menstrual period was the optimal age at event, but when this age was missing age at menarche was used. If both ages were missing, the larger of age 16 and age at diagnosis plus 5 was used. For normal status, age at last menstrual period was used when this age was greater than 40, otherwise, when this age was less than 40, the smaller of age 40 and age at last survey that contains MH information was used as age at event.
It should be noted that 129 survivors had clear age intervals in which their ovarian function was normal, but their ovarian status became unclear after a certain age. Therefore, they were retained in the analysis until their ovarian status could not be ascertained based on the available information (the details are in Appendix B).
2.4 Exclusion criteria
To ensure the data used for analysis is accurate, survivors who did not participate in any questionnaire containing the menstrual history section (n = 1,774) and those who did not attain age 18 at their latest follow-up or provided menstrual history information through a proxy (n = 766) were excluded from the analysis. Furthermore, the subject was excluded if her menstrual status could not be determined (n = 86), or if she received ≥ 30 Gy cranial and/or pituitary radiation or was suspected pituitary dysfunction (n = 765), diagnosed as Turner or Down’s Syndrome (n = 6), developed an SMN within 5 years of primary cancer (n = 21), or had conflicting age information (i.e. age at SPM, NSPM, or SMN < 9 years old and age at event occurred 3 years prior to age at diagnosis, see Appendix B) (n = 27), leaving 7,891 survivors of the original sample (70%) available for analysis (Figure 2.2). The final data set includes 7,891 observations with 61 variables. The data dictionary for the final data set was available in Appendix C.
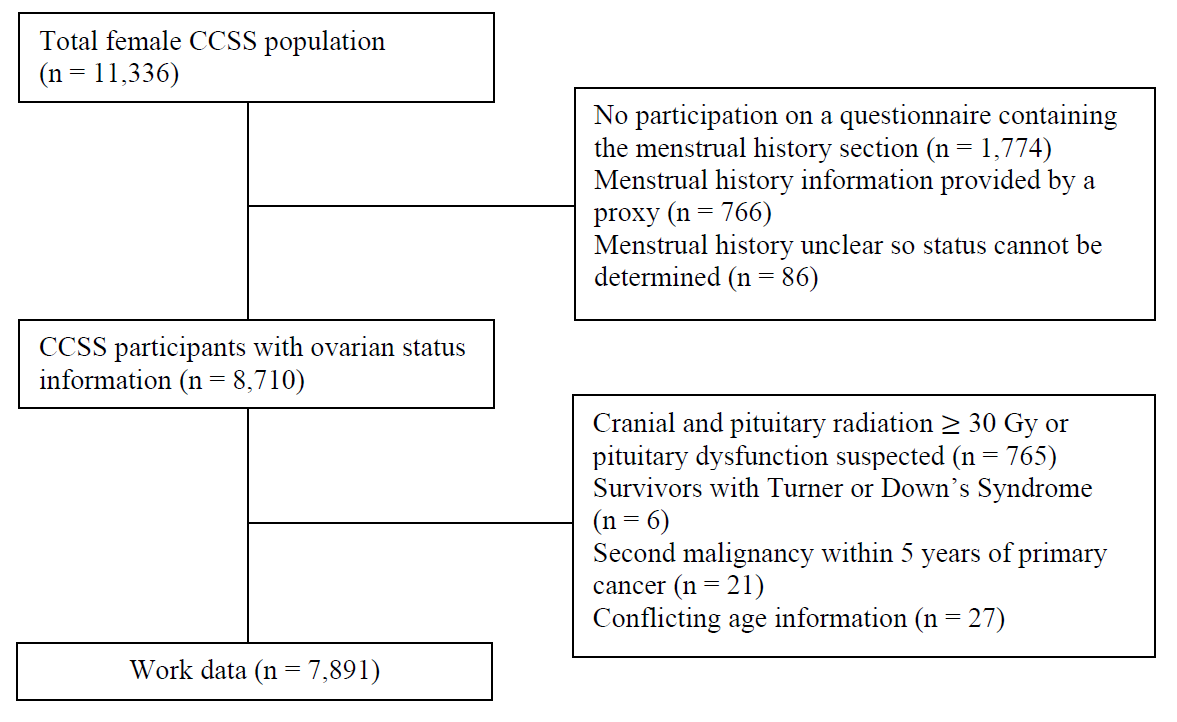
Figure 2.2: Exclusion flowchart
2.5 Exploring the elements
In the final data set, 6.2% of the total information was missing and 19% of observations had one or more missing values. Understanding the missingness and missing pattern between variables was the first step to deal with the problem of missing. In this section, missing patterns were investigated using several visualizing methods.
Figure 2.3 showed the missing pattern of 61 variables for 7,891 observations (y-axis) in the final data set. Variables cohort (original of expansion), date of birth (“d_birth”), ovarian status (“status”), and cancer type (“diagnose”) were fully observed. Among variables with missing values, age at event (“a_event”) had the lowest missing percentage (0.48%). Variables related to cancer treatments that were extracted from medical records had higher missing percentages, ranging from 6.01% to 12.55%.
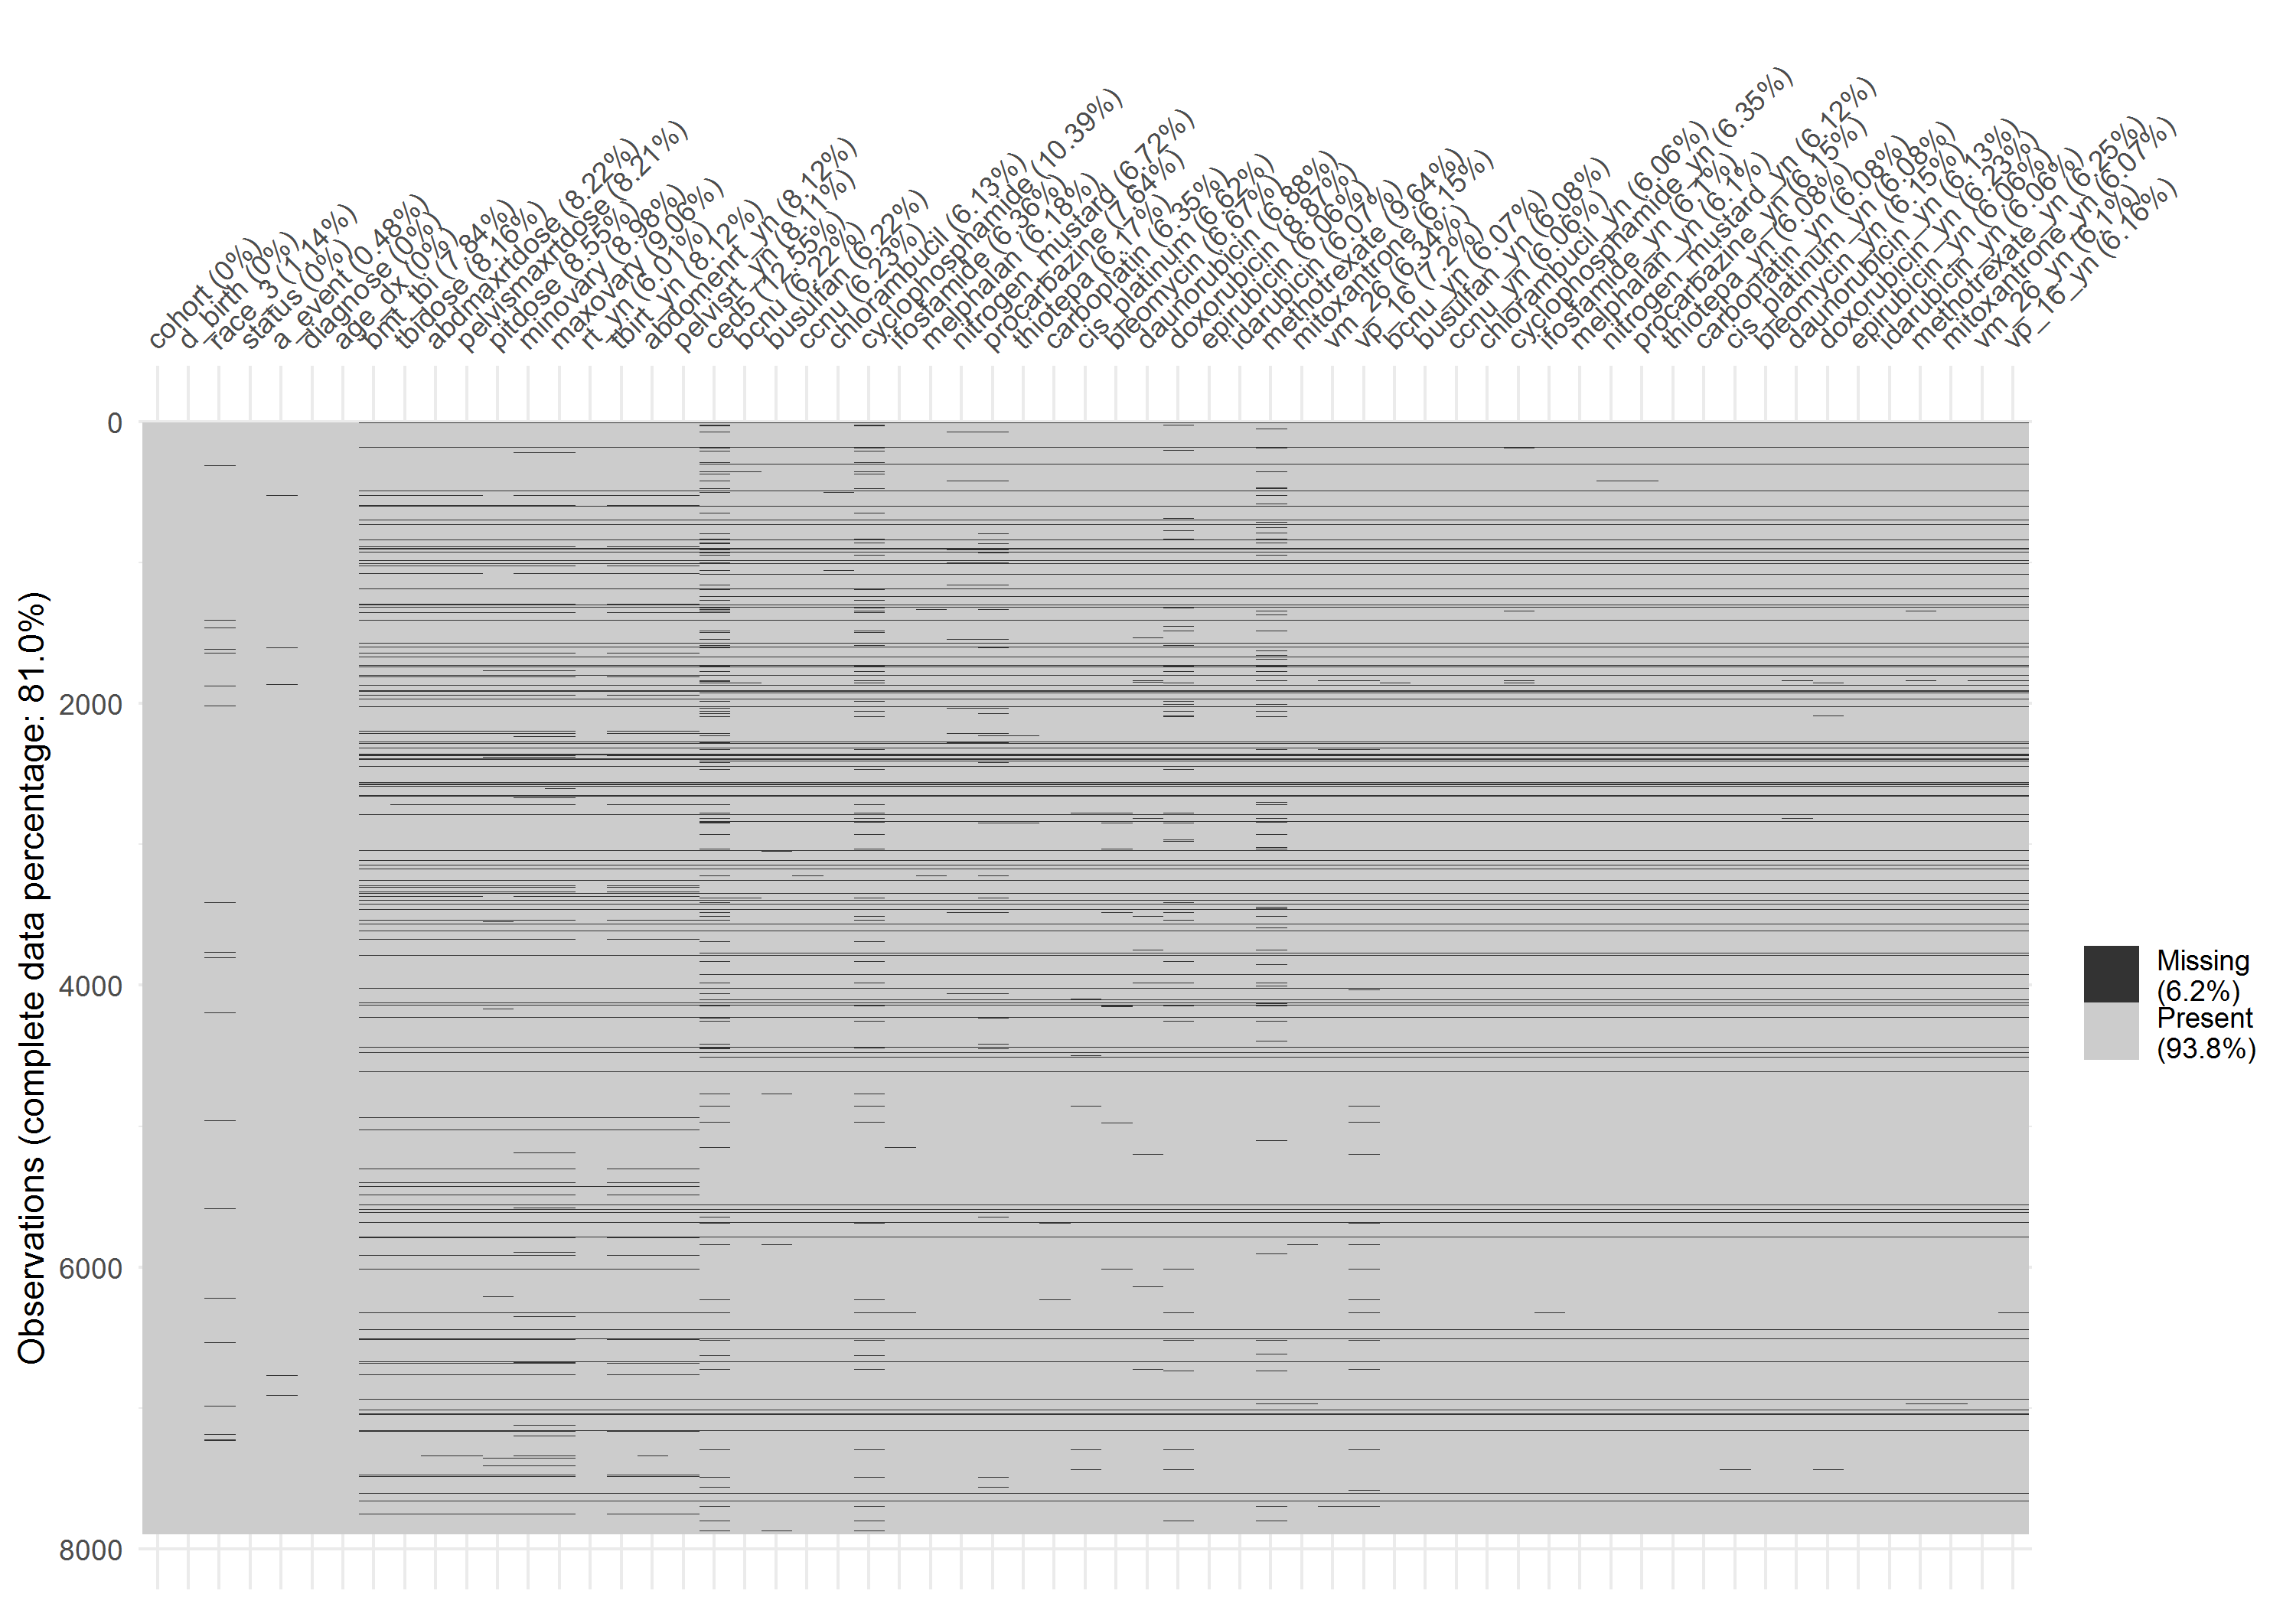
Figure 2.3: Missing pattern of final data
Figure 2.4 showed the missing percentages of variables categorized by ovarian status, the missing percentages in POI and SPM were slightly higher than that in the normal group, but the pattern among the three status was similar.
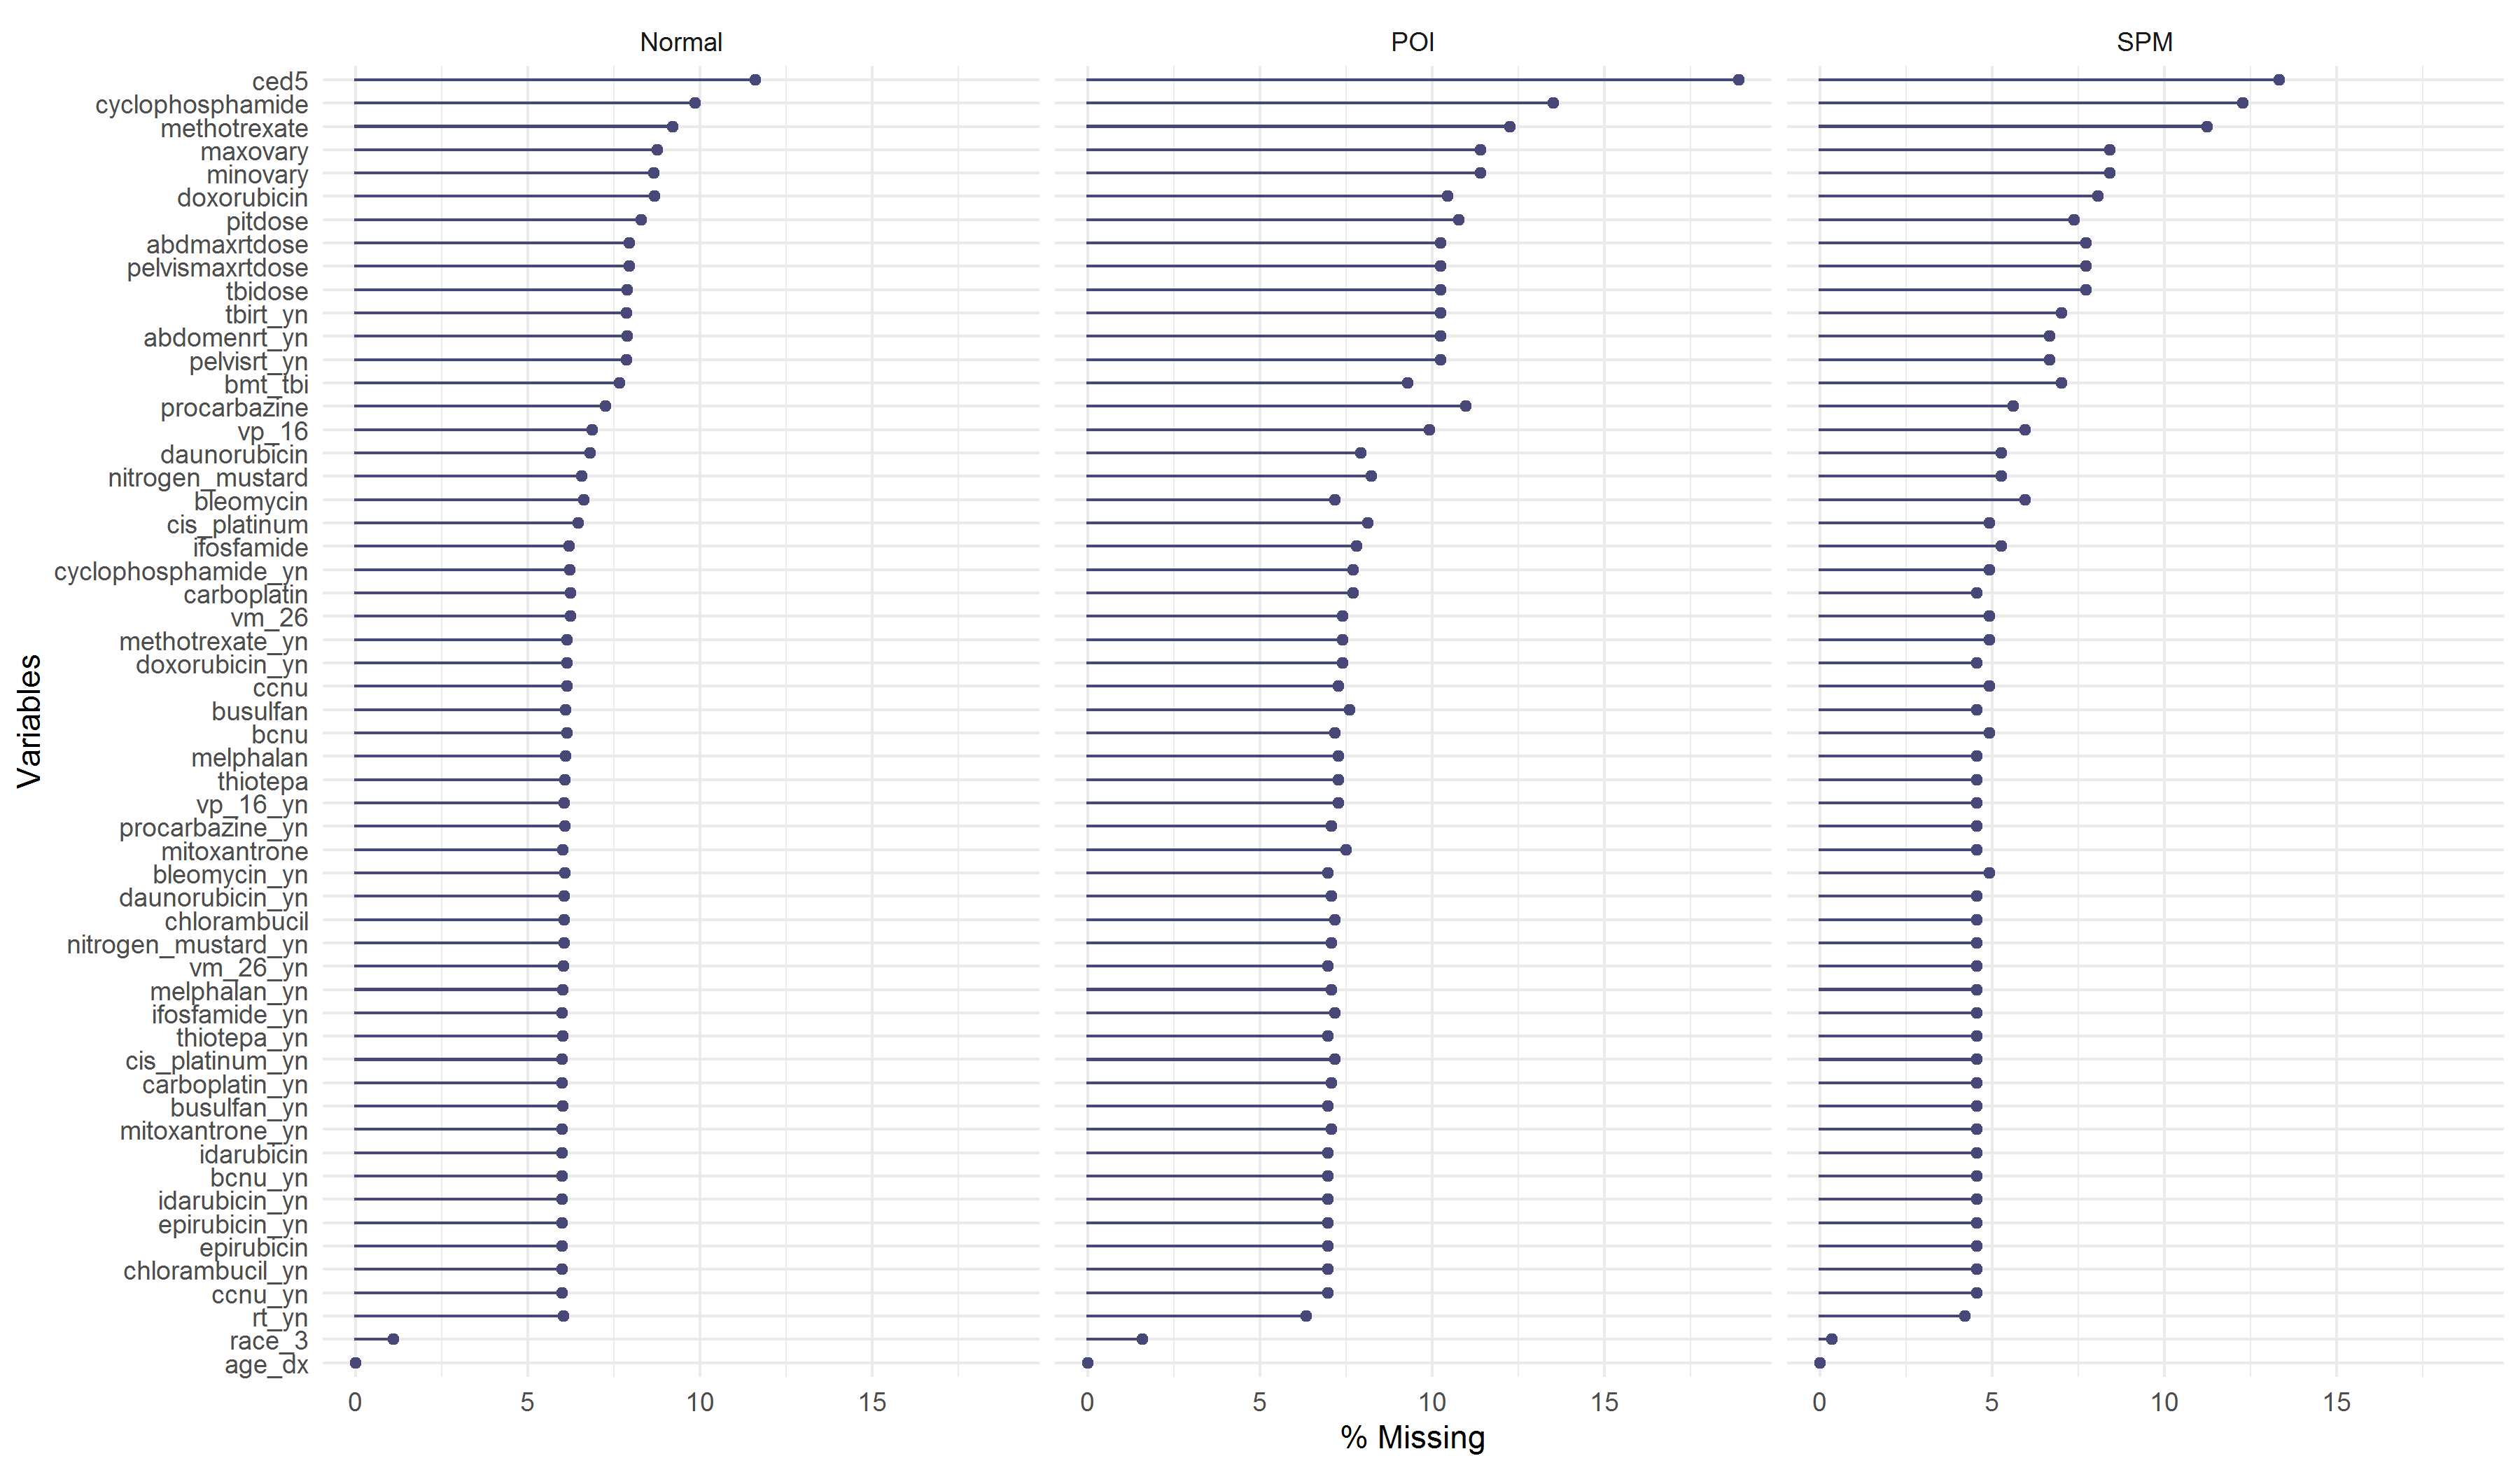
Figure 2.4: Missing percentages by ovarian status
Figure 2.5 showed how the missing variables were connected. Each row represented a missing combination, and each column indicates a variable. The numbers on the left indicated the frequencies of missing with the same combinations, while the numbers on the right referred to how many variables were missing in each respective row. Finally, the bottom numbers indicated the frequencies of missing values in each variable. For example, in the first row, there were 6,319 subjects with no missing values, and in the second row, 420 subjects had missing values in 54 common variables.
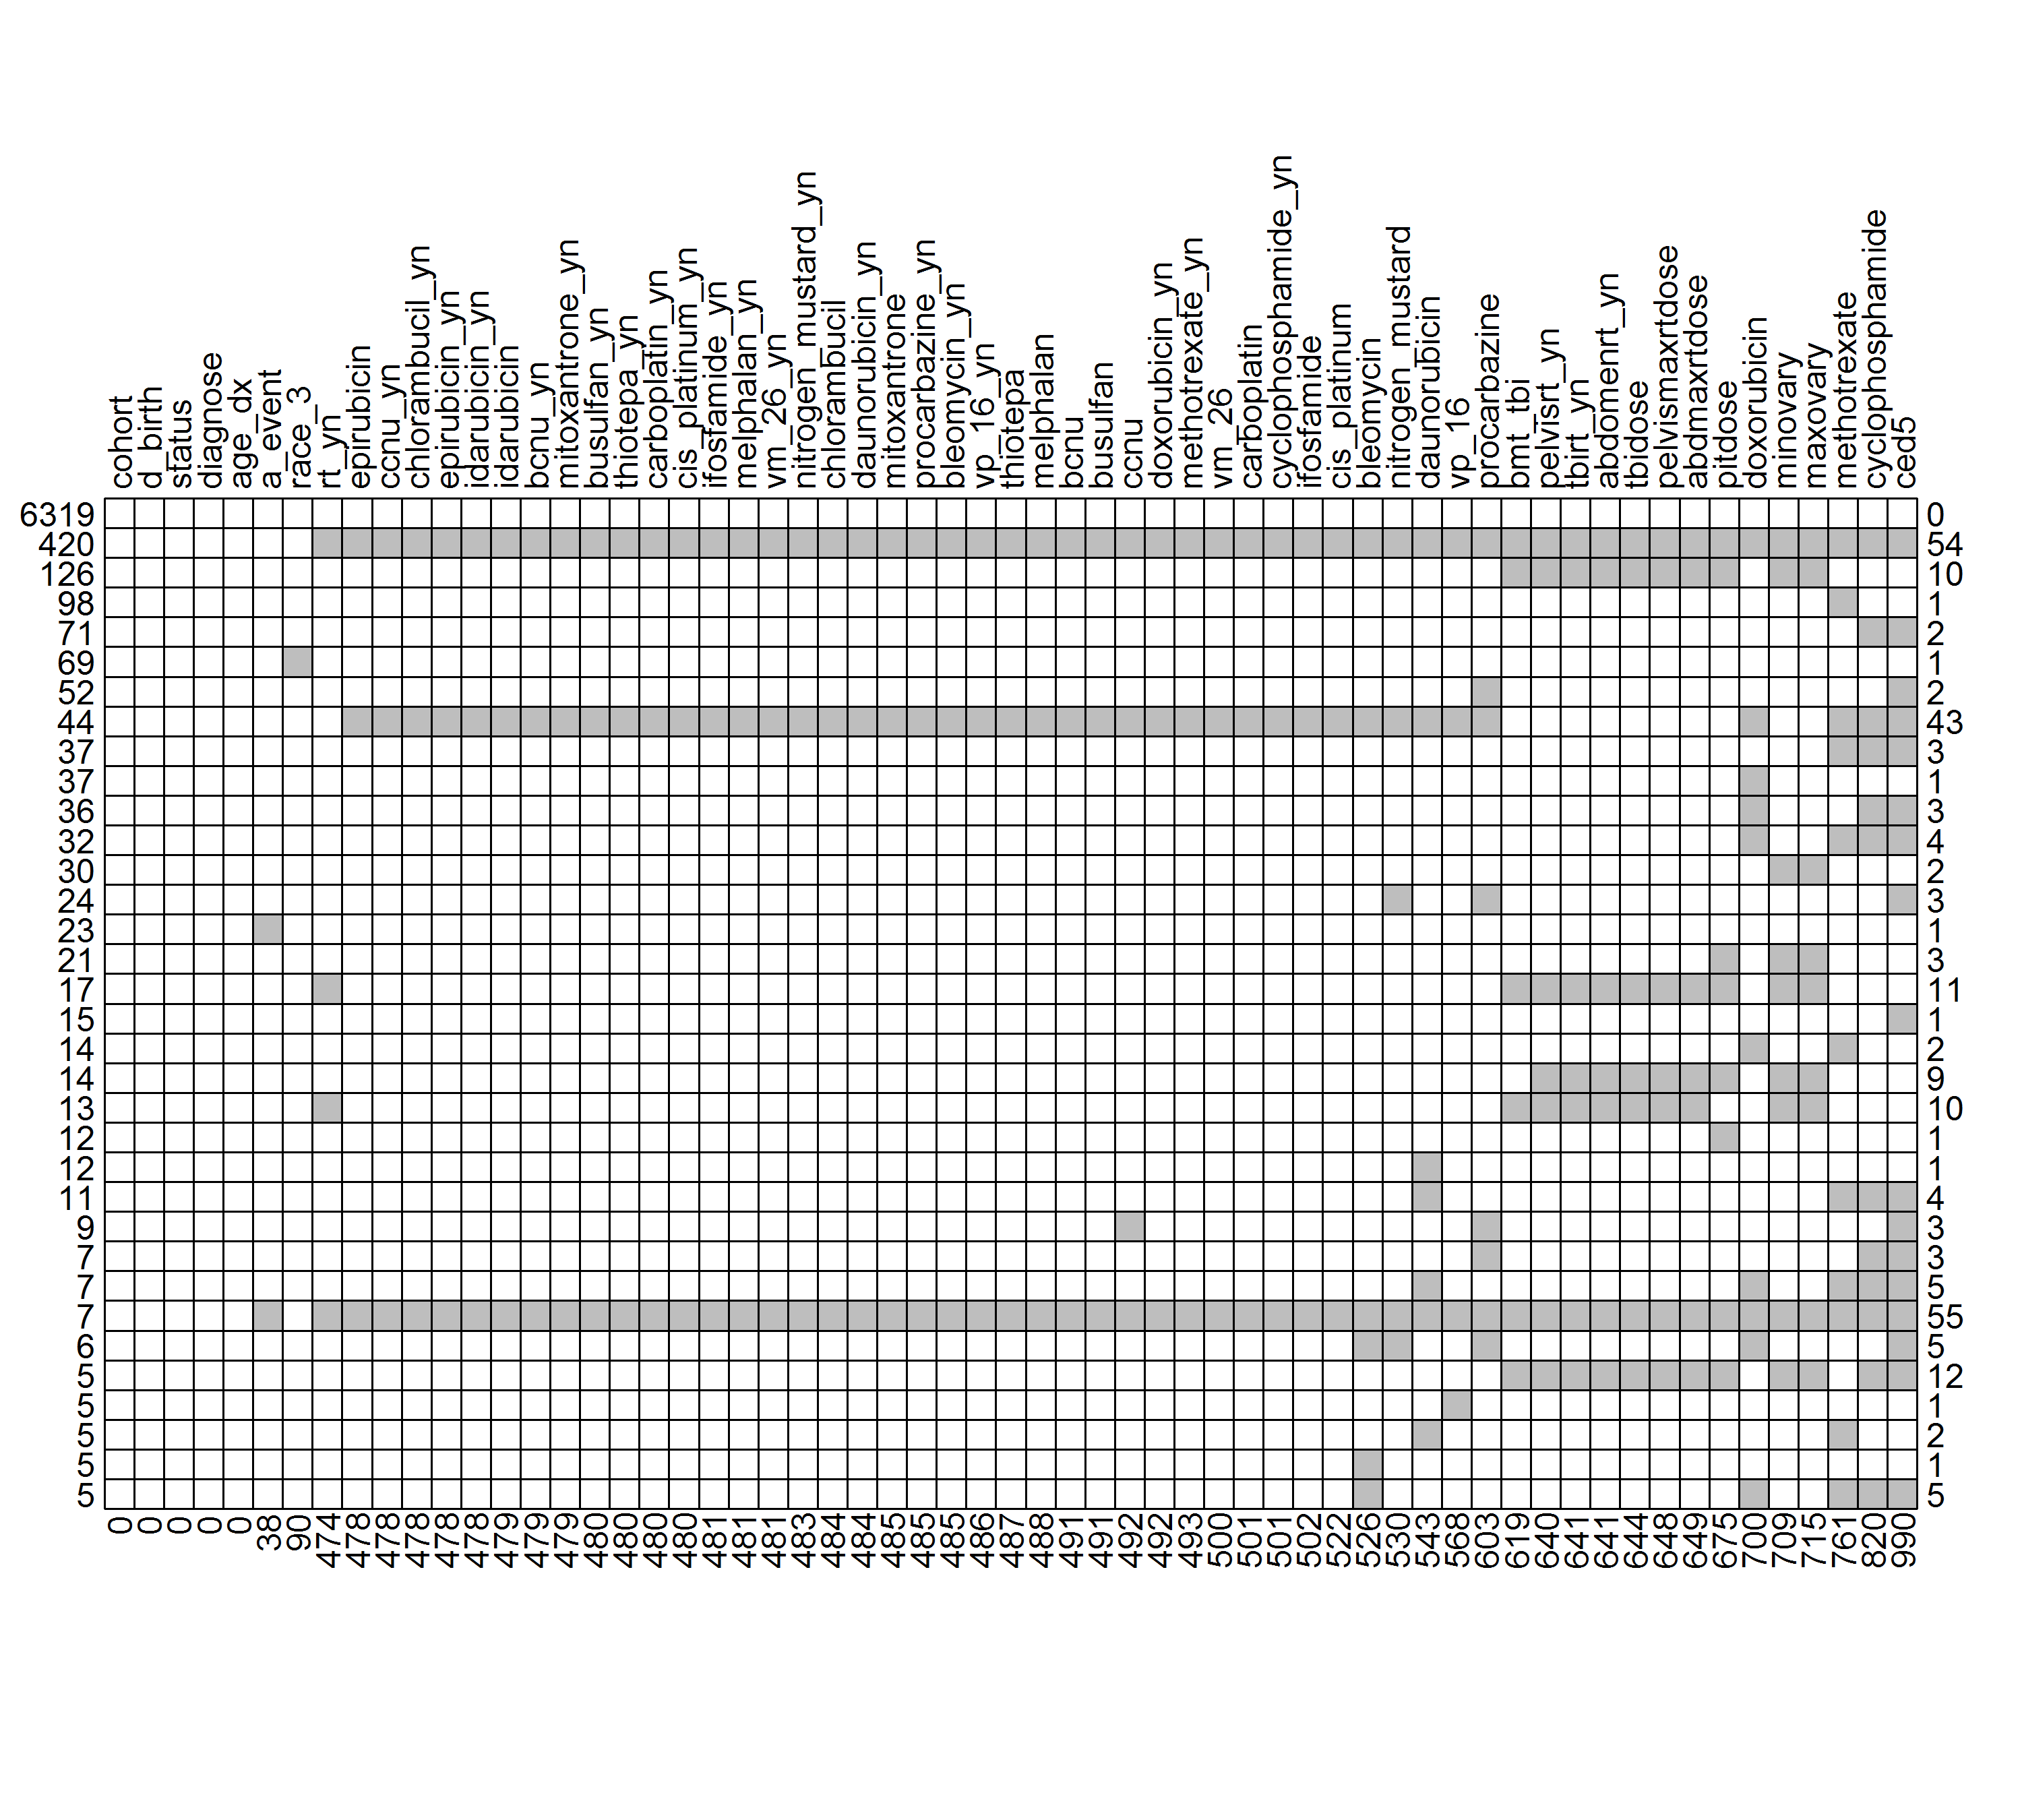
Figure 2.5: Missing patterns. (Grey boxes denote missing variables). A partial table containing missing combinations with frequencies equal or greater than 5
2.6 Exploring outcome variables
2.6.1 Distributions of age at event
Figure 2.6 showed the distribution of age at event stratified by the three levels of ovarian function. The distribution of age at POI appears skewed right. Age at SPM had a higher median age (approximately 33) compared to age at POI (approximately 18). Due to rules for assigning age at event (detailed in Appendix B), there was one peak (age = 16) in age at POI and one peak (age = 40) in age at event for survivors with normal ovarian status.
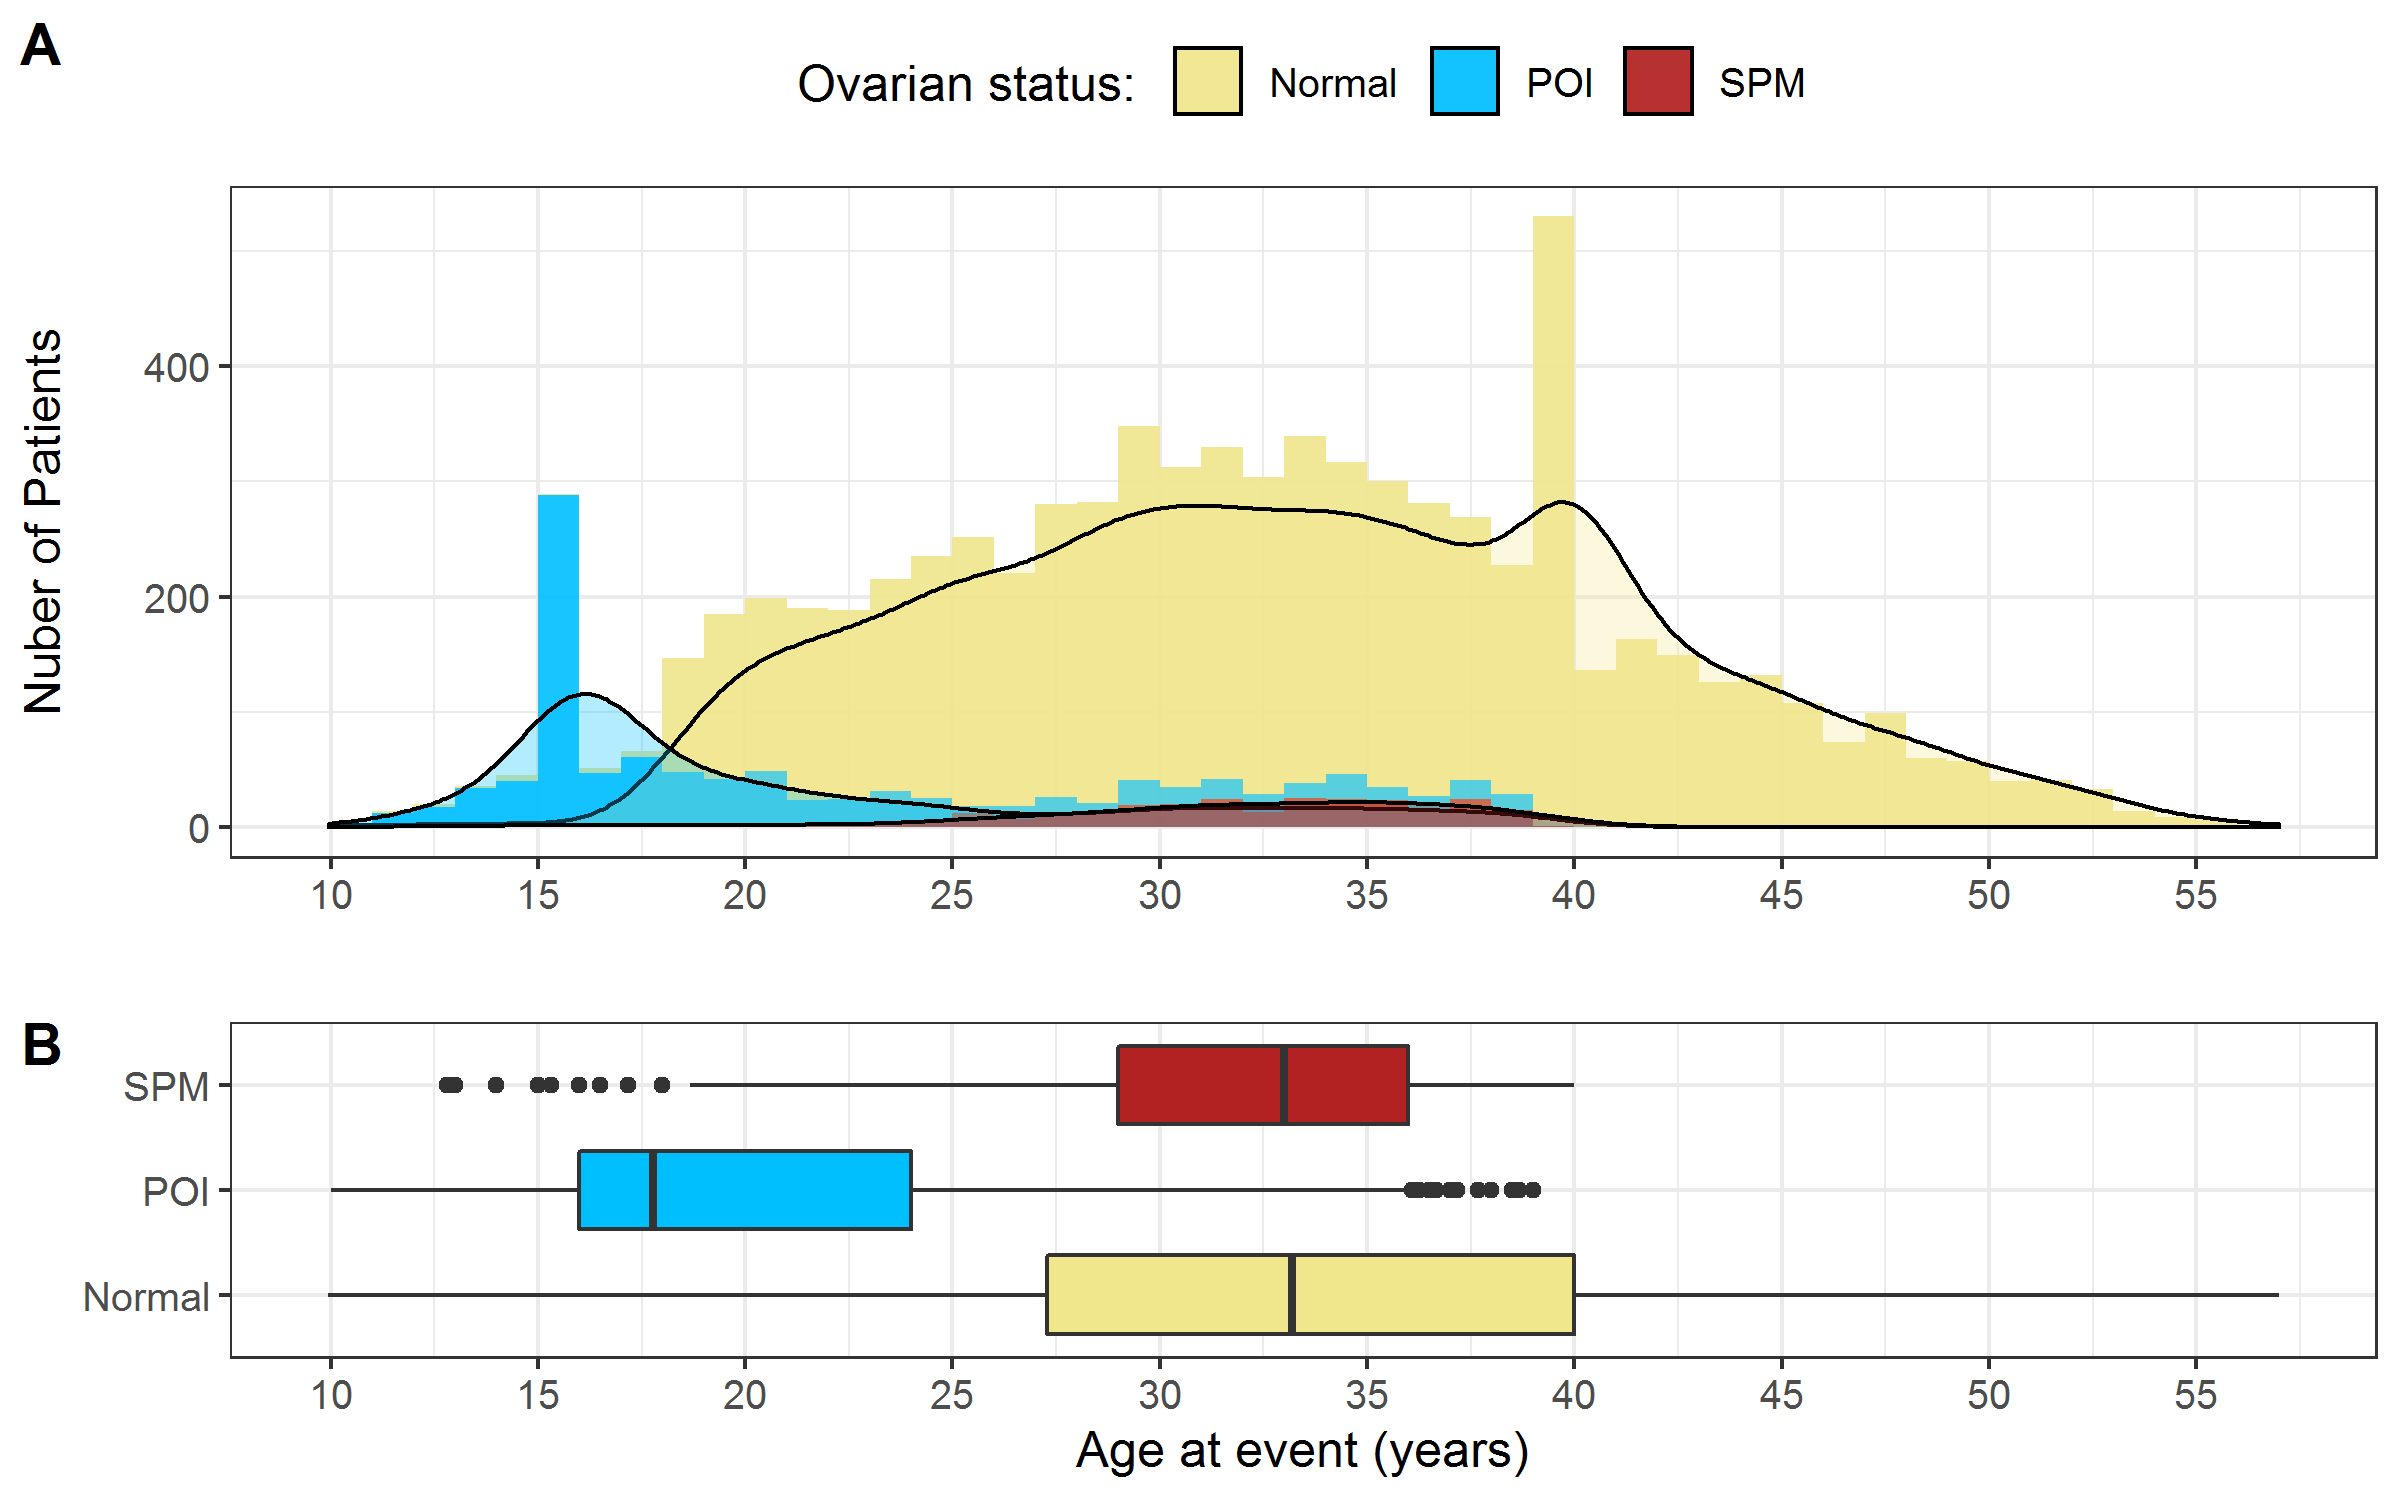
Figure 2.6: Distribution of age at event stratified by ovarian status. A) Histogram B) Boxplot. Note: The 129 survivors with unclear status mentioned in section 2.3.3 were excluded.
2.6.2 The censoring patterns
To visualize the occurrence of censoring (the ovarian status was only partially observed before cut-off ages), Figure 2.7 showed the age at event in a different way: all the age intervals from age 9 to age at event are plotted as horizontal lines colored with three different colors. The yellow solid line indicated that the survivor’s ovarian status was normal. The blue dotted line indicated that the survivor developed POI while the red dashed line indicated that the survivor experienced SPM.
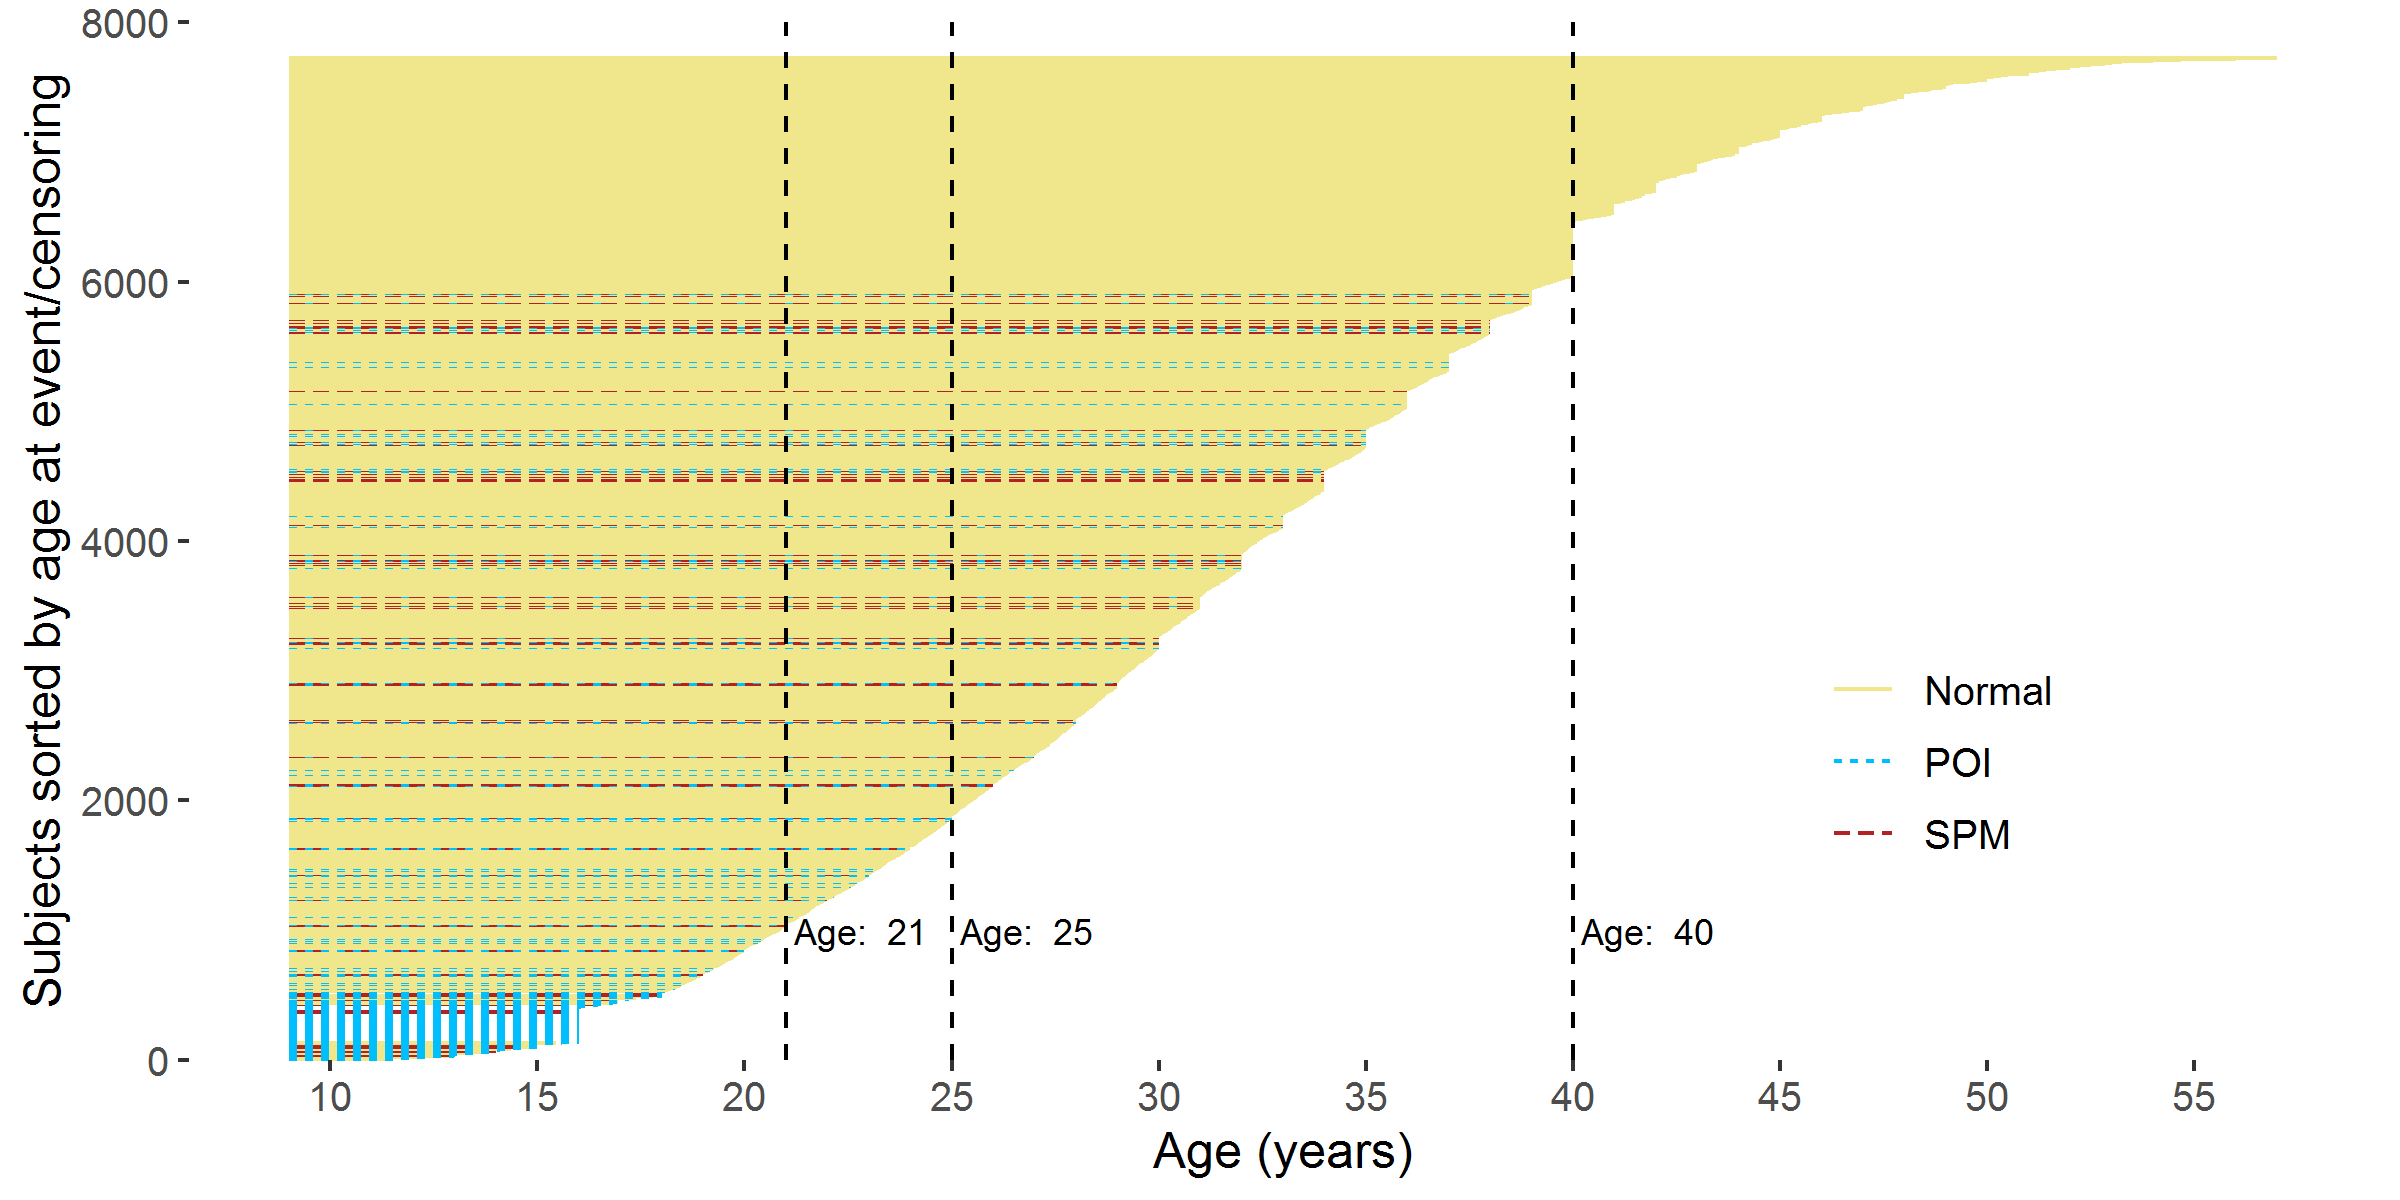
Figure 2.7: Age interval of each participant from 9 years old to the age at event/censoring. Note: The 129 survivors with unclear status mentioned in section 2.3.3 were excluded.
As the age threshold increases, a larger proportion of survivors becomes censored (shown in Figure 2.8). The proportions of ovarian status at different age thresholds and more details on percentages of censoring were summarized in Appendix D.
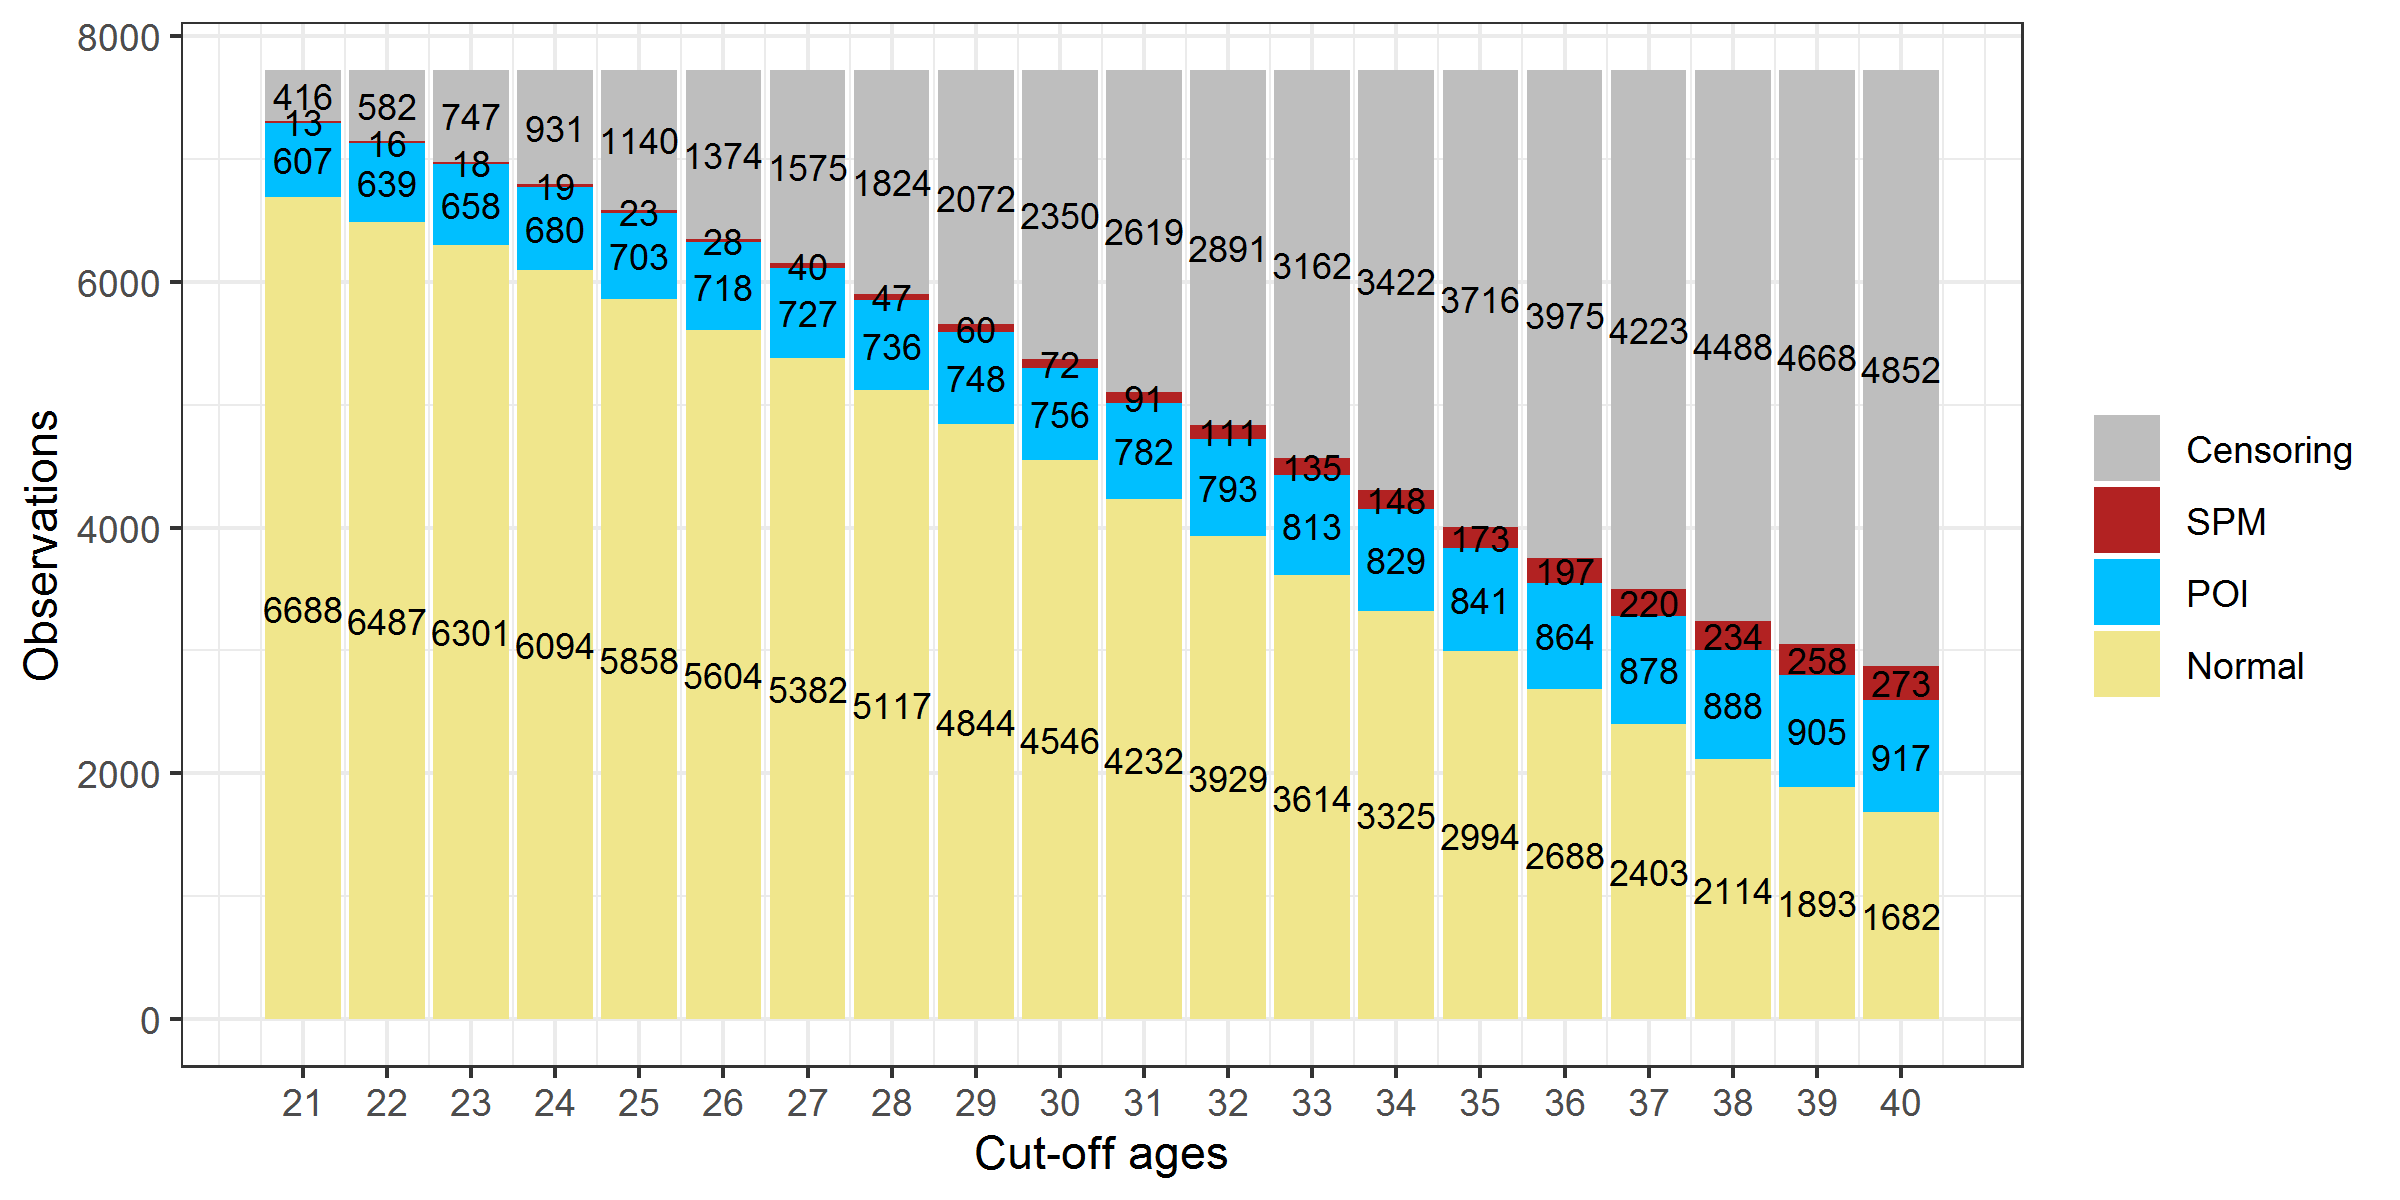
Figure 2.8: Ovarian status composition in CCSS participants at different age thresholds. Note: The 129 survivors with unclear status mentioned in section 2.3.3 were excluded.
2.6.3 Cumulative Incidence Curves
Figure 2.9 showed the cumulative incidence curve of POI and SPM respectively. A large proportion of AOF (one type of POI) experienced the event before age 20; therefore, the cumulative incidence of POI increased rapidly at the beginning, especially at age 16 where there was a big jump due to the rule of assigning age at event. After 25, the cumulative incidence of POI went up steadily and reached about 15% by age 40. This number was close to the sum of the prevalence of AOF (6.3%) and cumulative incidence of NSPM (8%) reported in the previous CCSS reports (Levine et al. 2018; Chemaitilly et al. 2006; Sklar et al. 2006). The cumulative incidence of SPM increased slowly at the beginning but accelerated more rapidly after surpassing 25 years old until reaching around 7% at age 40.
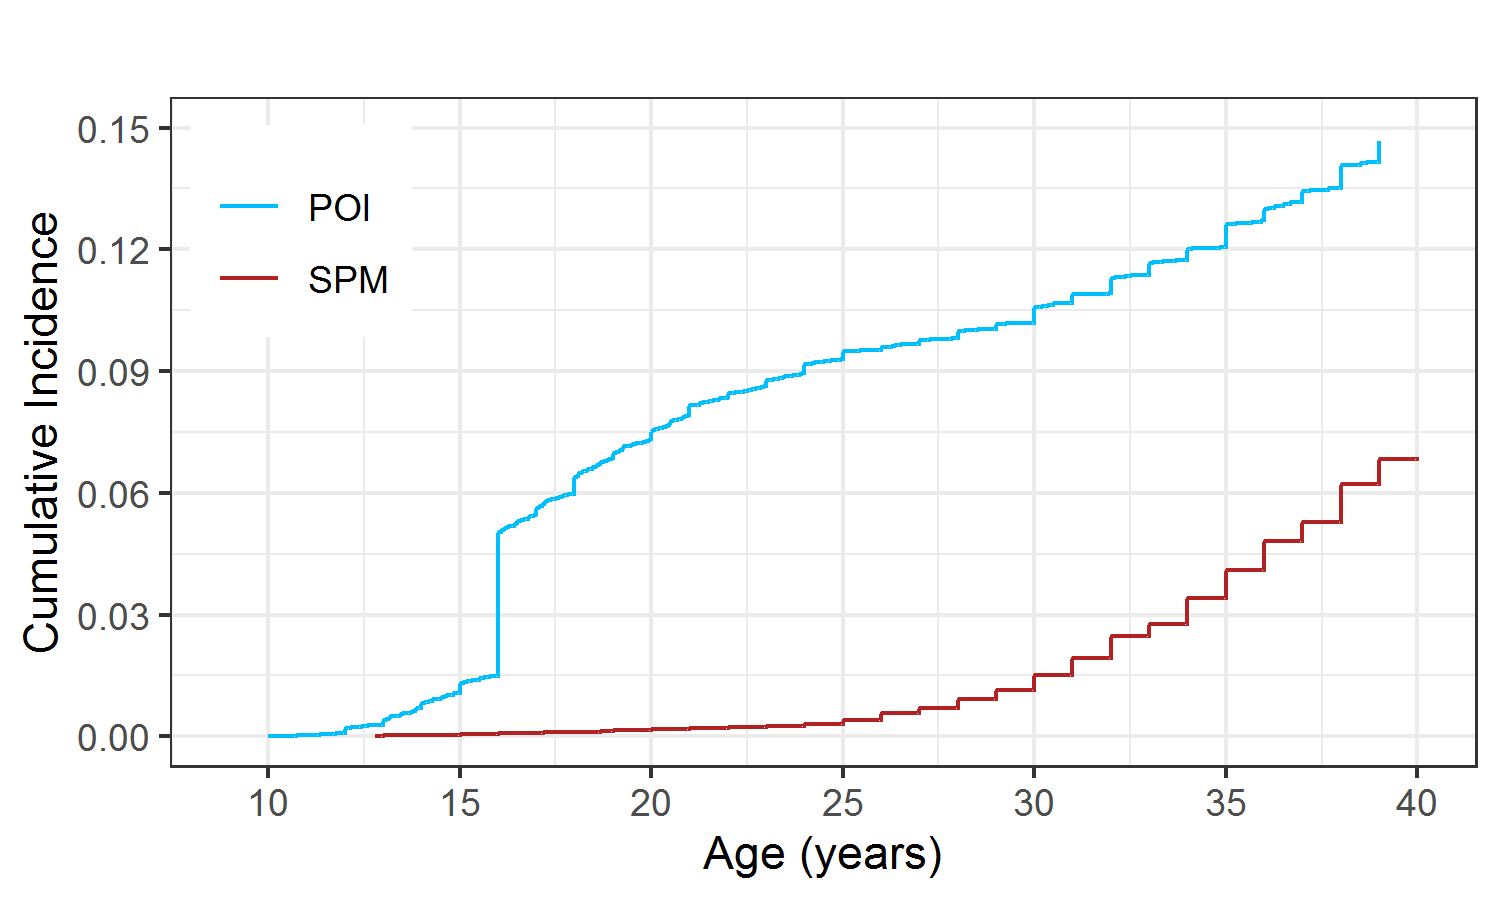
Figure 2.9: Cumulative incidence of POI and SPM
2.7 Predictors
Risk factors for developing POI have been identified in the literature. They were irradiation to the abdomen or pelvis, total body irradiation, and alkylating chemotherapy agents (Chemaitilly et al. 2006; Bedoschi, Navarro, and Oktay 2016; Kim, Kim, and Ku 2018; Sonmezer 2004). 4,20–22 Other than cancer treatments, age at diagnosis (or age at the time of treatment) was also regarded as related to the risk of developing POI.(Medrano et al. 2018)
In this section, I inspected all the available exposure variables in the final data set and explored their relationships with an age-specific ovarian status (age threshold = 25). Table 2.1 showed the distribution of the age-specific ovarian status.
| Normal | POI | SPM | Censored | |
|---|---|---|---|---|
| Count | 5968 | 703 | 23 | 1140 |
| Percent | 76.2% | 9% | 0.3% | 14.6% |
2.7.1 Race
The self-reported race was merged into 3 categories: white, black, and other. The percent of self-reported white was 86.1%, while the percentages of black and other races were 6.1% and 6.6%, respectively. The missing proportion was 1.1%. Table 2.2 showed the distribution of race. 8.6% of white developed POI, while higher percentages of POI were seen in black (9.8%) and other (11.9%), which indicated that race might be a risk factor and black and other had a higher risk of developing POI comparing to white people.
| NORMAL n(%) | POI n(%) | SPM n(%) | CENSORED n(%) | |
|---|---|---|---|---|
| WHITE | 5221(77.3) | 582(8.6) | 21(0.3) | 926(13.7) |
| BLACK | 335(70.1) | 47(9.8) | 1(0.2) | 95(19.9) |
| OTHER | 356(68.7) | 62(12) | 1(0.2) | 99(19.1) |
| MISSING | 56(63.6) | 12(13.6) | 0(0) | 20(22.7) |
| TOTAL | 5968(76.2) | 703(9) | 23(0.3) | 1140(14.6) |
2.7.2 Age at diagnosis
Figure 2.10 showed the distribution of age at diagnosis stratified by ovarian status by age 25. Visually, there were two peaks at approximately 4 years old and 14 years old for Normal and POI. SPM had only 23 observations (Table 2.1), therefore was omitted in Figure 2.10A. The boxplots in Figure 2.10 showed that the median age at diagnosis was slightly younger in POI compared to Normal and SPM. However, this should not lead to the conclusion that patients diagnosed at a younger age tend to develop POI, because the boxplots did not take censoring information into account, and age at diagnosis was strongly associated with censoring (Figure 2.10A) as patients diagnosed at a younger age had more potential to be younger than age 25 at the time of the last follow-up (for example, if a patient diagnosed at age 2 years old in 1999, she only attained 20 in 2018).
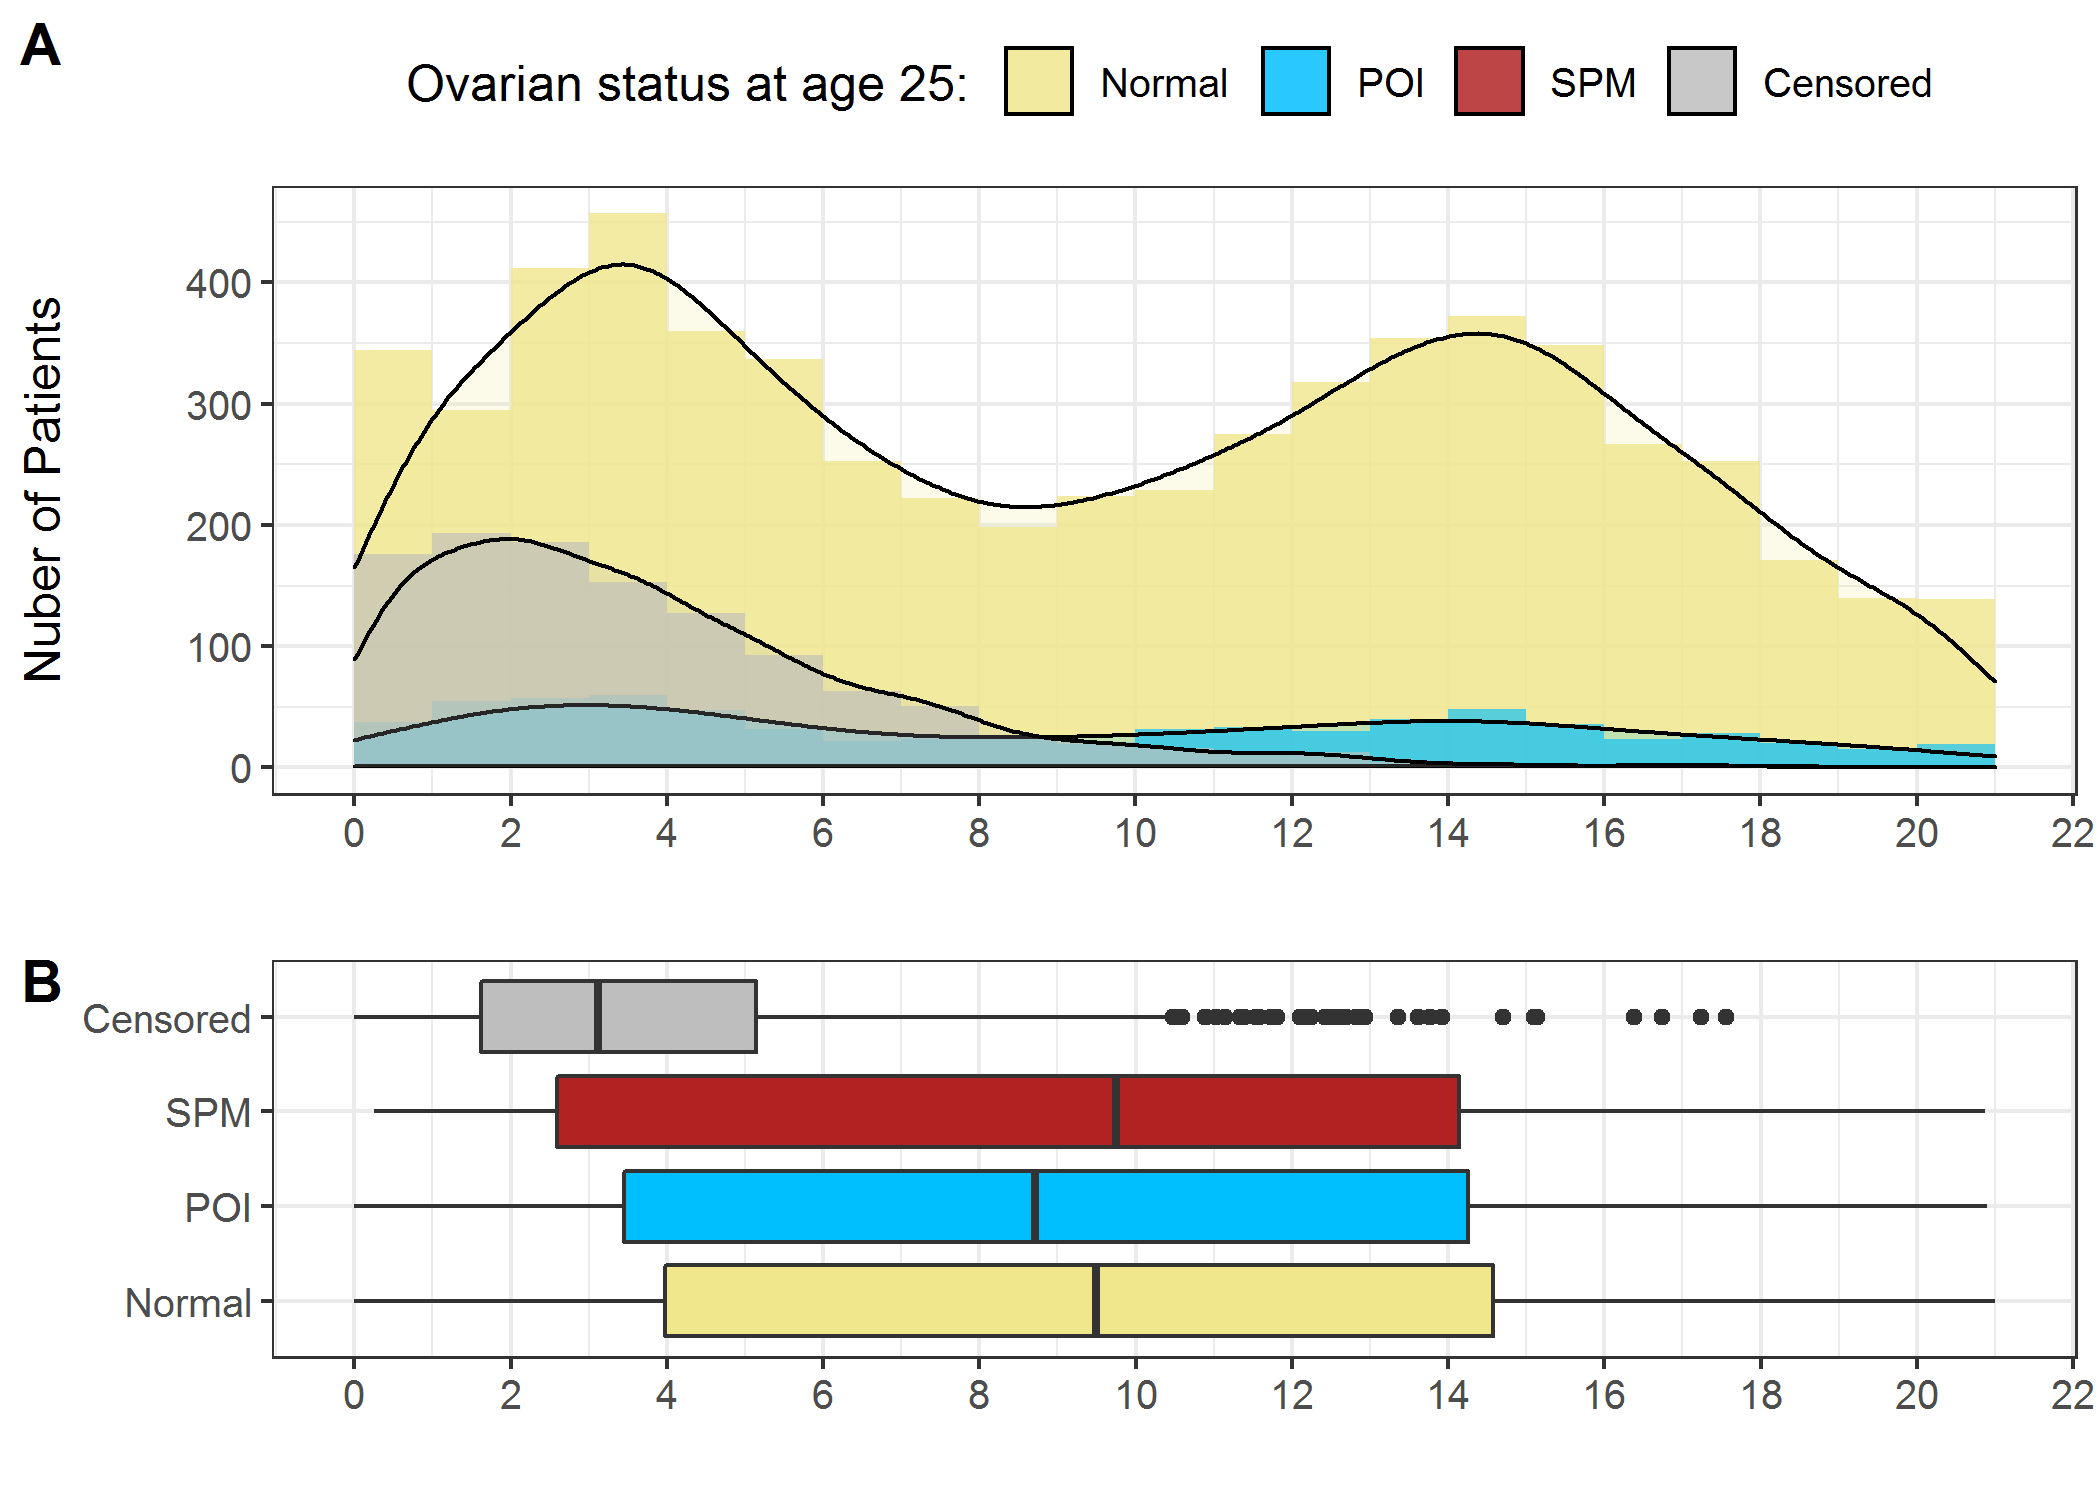
Figure 2.10: Distribution of age at diagnosis. A) Histogram and density curve; B) Boxplots
2.7.3 Radiotherapy
Irradiation can cause ovarian damage, and the degree of the radiation-induced damage depends on the radiation dose, radiation field, fractionation schedule, and age at the time of treatment.(Whb and Cjh 2009, 2009; Bath et al. 1999) Research has shown that irradiation to the abdomen and pelvis appears to lead to the highest risk of developing POI.(Chemaitilly et al. 2006; Whb and Cjh 2009; Bath et al. 1999; Meirow and Nugent 2001) As for the irradiation doses, it has been reported that receiving pelvic or abdominal radiation doses Gy for post-pubertal girls and Gy for prepubertal girls substantially increased the risk of POI.(Rodriguez-Wallberg and Oktay 2010)
Table 2.3 showed that a similar proportion (around 44%) of patients in the study sample received irradiation to the abdomen, pelvis, pituitary, and both ovaries.
| Irradiation | Not.received | Received | Missing | Overall |
|---|---|---|---|---|
| abdmaxrtdose | 3707(47.3%) | 3487(44.5%) | 640(8.2%) | 7834(100%) |
| pelvismaxrtdose | 3707(47.3%) | 3488(44.5%) | 639(8.2%) | 7834(100%) |
| pitdose | 3721(47.5%) | 3446(44%) | 667(8.5%) | 7834(100%) |
| minovary | 3708(47.3%) | 3426(43.7%) | 700(8.9%) | 7834(100%) |
| maxovary | 3708(47.3%) | 3420(43.7%) | 706(9%) | 7834(100%) |
Figure 2.11 showed the density curves of radiation doses (only doses > 0) to different body regions categorized by ovarian status at age 25 (density curves for SPM were not plotted as SPM has only 23 observations). It should be noted that the patients who received more than 30Gy irradiation to pituitary have been excluded. Visually, irradiation dose to abdomen, pelvis, and both ovarian doses could well separate Normal and POI groups, indicating that they might be useful risk factors in predicting the risk of developing POI before 25 years old.
It should be noted that the concern of bias caused by the censored information, however, was not a big issue in analyzing the effect of treatment exposures as these treatments were unlikely to be associated with censoring.
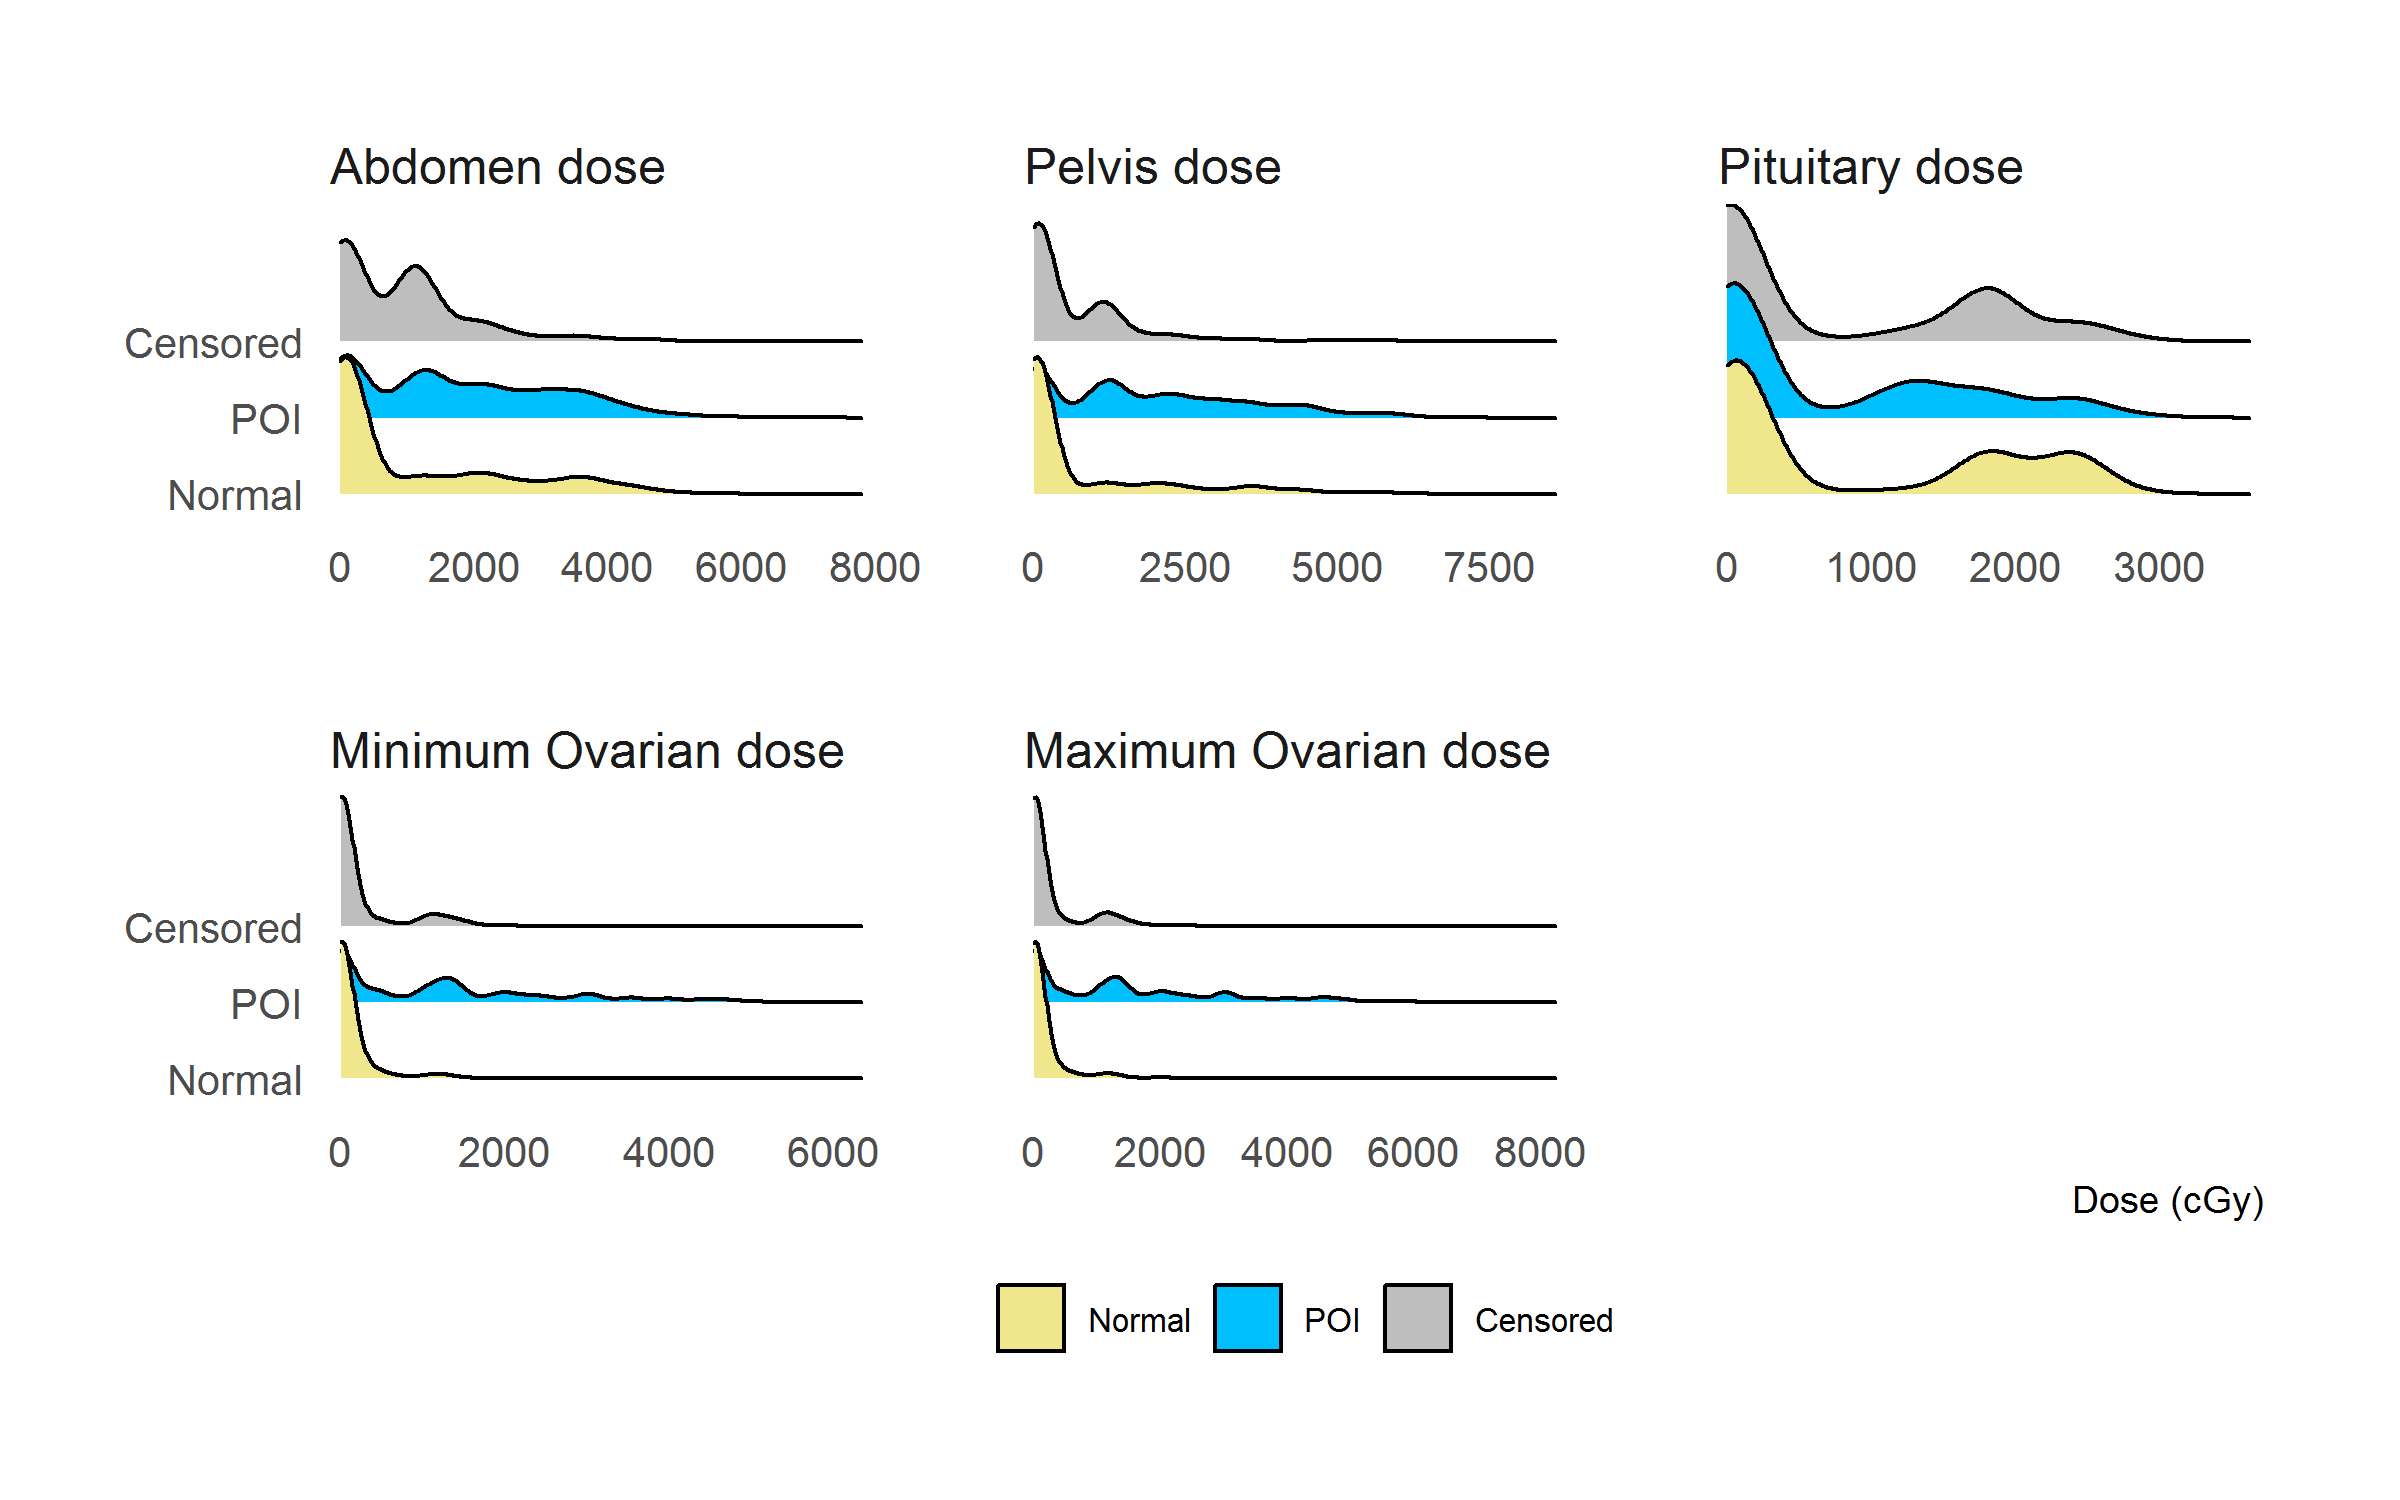
Figure 2.11: Distribution of radiation doses (> 0) categorized by ovarian status at 25
2.7.4 Chemotherapy
Research has shown that gonadotoxic chemotherapy can bring ovaries damage ranging from low (can be recovered to normal ovarian function) to serious (ovarian atrophy and complete ovarian failure) (Bedoschi, Navarro, and Oktay 2016). The degree of chemotherapy-induced damage depends on agents’ type and dose. (Meirow and Nugent 2001)
Alkylating agents are widely used for the treatment of pediatric cancers – these agents inhibit cancer cell division by breaking DNA strands. Therefore, they are also toxic to normal cells, particularly those sensitive to DNA damage, which includes oocyte and follicular cells in ovaries.(“Alkylating Antineoplastic Agent” 2020) The impact of alkylating agents on ovaries has been assessed by histological analysis.(Oktem and Oktay 2007) Alkylating agents result in significantly lower counts of primordial follicles compared with those who have not received chemotherapy and even those who received non-alkylating agents.(Oktem and Oktay 2007) The identified high risk alkylating agents include Cyclophosphamide, Busulfan, Melphalan, Procarbazine, and Ifosfamide (Medrano et al. 2018). To estimate cumulative alkylating agent exposure’s effect, the Cyclophosphamide Equivalent Dose (CED) was developed to allow the comparison of different common alkylating agents. (Green et al. 2014)
Doxorubicin, an anthracycline (a type of anti-tumor antibiotics) was used to treat a wide range of cancers. Similar to alkylating agents, these agents can also cause DNA double-strand breaks leading to the death of primordial follicles.(Soleimani et al. 2011) Recent studies have suggested doxorubicin is most closely linked to ovarian failure among the non-alkylating agents. (Bedoschi, Navarro, and Oktay 2016, 2019; Spears et al. 2019; Bar et al. 2003)
Cisplatin is a heavy metal-based compound and acts as a DNA cross-linking agent that interferes with DNA repair mechanisms, blocking cell division.(Dasari and Bernard Tchounwou 2014) Its mechanisms of ovarian toxicity has not been well studied because female patients treated with cisplatin have usually received it as part of a multiple-drug regimen.(Spears et al. 2019) According to recent studies, it was considered as a moderate risk factor for ovarian failure. (Dasari and Bernard Tchounwou 2014; Yuksel et al. 2015)
VP-16 (etoposide), a topoisomerase inhibitor, unwinds during DNA replication and break DNA double-strand like cisplatin. Therefore, VP-16 is especially toxic to cells that are sensitive to DNA damage, such as granulosa cells and oocytes.(Morgan et al. 2012)
Table 2.4. summarized the risk of ovarian toxicity of chemotherapy agents (which were available in our data set) reported in previous research.
| Type | Chemotherapy agent name | Risk | Reference |
|---|---|---|---|
| Alkylating agent | BCNU (Carmustine) | High risk | |
| Busulfan | High risk | ||
| CCNU (Lomustine) | High risk | ||
| Chlorambucil | High risk | ||
| Cyclophosphamide | High risk | ||
| Ifosfamide | High risk | ||
| Melphalan | High risk | ||
| Nitrogen mustard | High risk | ||
| Procarbazine | High risk | ||
| Thiotepa | High risk | ||
| Platinum compounds | Carboplatin | Intermediate risk | |
| Cisplatin | Intermediate risk | ||
| Antibiotics | Bleomycin | Low risk | |
| Anthracyclines, anthraquinone | Daunorubicin | NA | |
| Doxorubicin | Intermediate risk | ||
| Epirubicin | NA | ||
| Idarubicin | NA | ||
| Mitoxantrone | NA | ||
| Antimetabolites | Methotrexate | Low risk | |
| Epipodophyllotoxins | VM-26 (Teniposide) | NA | |
| VP-16 (Etoposide) | Low risk |
Table 2.5 showed the proportion of patients that received each type of chemotherapy. The three most used chemotherapy agents (shaded in yellow) were cyclophosphamide, methotrexate, and doxorubicin received by 2890 (36.7%), 2789 (35.4%), and 2647 (33.6%) patients, respectively. Other chemotherapy agents were much less used in this study sample. For example, eight chemotherapy agents (shaded in blue) were used by less than 100 patients in this study sample.
| Chemotherapy agent | Not.received | Received | Missing | Overall |
|---|---|---|---|---|
| bcnu | 7214(92.1%) | 137(1.7%) | 483(6.2%) | 7834(100%) |
| busulfan | 7290(93.1%) | 61(0.8%) | 483(6.2%) | 7834(100%) |
| ccnu | 7288(93%) | 62(0.8%) | 484(6.2%) | 7834(100%) |
| chlorambucil | 7342(93.7%) | 16(0.2%) | 476(6.1%) | 7834(100%) |
| cyclophosphamide | 4149(53%) | 2876(36.7%) | 809(10.3%) | 7834(100%) |
| ifosfamide | 7005(89.4%) | 336(4.3%) | 493(6.3%) | 7834(100%) |
| melphalan | 7272(92.8%) | 82(1%) | 480(6.1%) | 7834(100%) |
| nitrogen_mustard | 6990(89.2%) | 324(4.1%) | 520(6.6%) | 7834(100%) |
| procarbazine | 6638(84.7%) | 604(7.7%) | 592(7.6%) | 7834(100%) |
| thiotepa | 7328(93.5%) | 27(0.3%) | 479(6.1%) | 7834(100%) |
| carboplatin | 7213(92.1%) | 128(1.6%) | 493(6.3%) | 7834(100%) |
| cis_platinum | 6874(87.7%) | 446(5.7%) | 514(6.6%) | 7834(100%) |
| bleomycin | 6758(86.3%) | 558(7.1%) | 518(6.6%) | 7834(100%) |
| daunorubicin | 6180(78.9%) | 1119(14.3%) | 535(6.8%) | 7834(100%) |
| doxorubicin | 4508(57.5%) | 2635(33.6%) | 691(8.8%) | 7834(100%) |
| epirubicin | 7364(94%) | 0(0%) | 470(6%) | 7834(100%) |
| idarubicin | 7305(93.2%) | 58(0.7%) | 471(6%) | 7834(100%) |
| methotrexate | 4306(55%) | 2778(35.5%) | 750(9.6%) | 7834(100%) |
| mitoxantrone | 7328(93.5%) | 29(0.4%) | 477(6.1%) | 7834(100%) |
| vm_26 | 7052(90%) | 290(3.7%) | 492(6.3%) | 7834(100%) |
| vp_16 | 6319(80.7%) | 957(12.2%) | 558(7.1%) | 7834(100%) |
Figure 2.12 showed the density curves of chemotherapy agents’ doses (only doses > 0) categorized by ovarian status at age 25 (density curves for SPM were not plotted as SPM has only 23 observations) for chemotherapy agents’ doses. The top two rows were ten alkylating agents, among which, busulfan, chlorambucil, melphalan, and thiotepa appeared to be good markers that can separate POI and normal. Other alkylating agents however had similar distribution between POI and normal. Among non-alkylating chemotherapy agents, the dose of mitoxantrone seemed to be a good marker for distinguishing POI and Normal. Doxorubicin, which was identified as closely linked to ovarian failure in the literature (Muñoz et al. 2016), however, seemed to have similar distribution between POI and Normal.
It should be noted that the density curves for chemotherapy agents that were not widely used cannot be reliably estimated, and the plots in Figure 2.12 were marginal analysis which did not consider the effect of confounders.
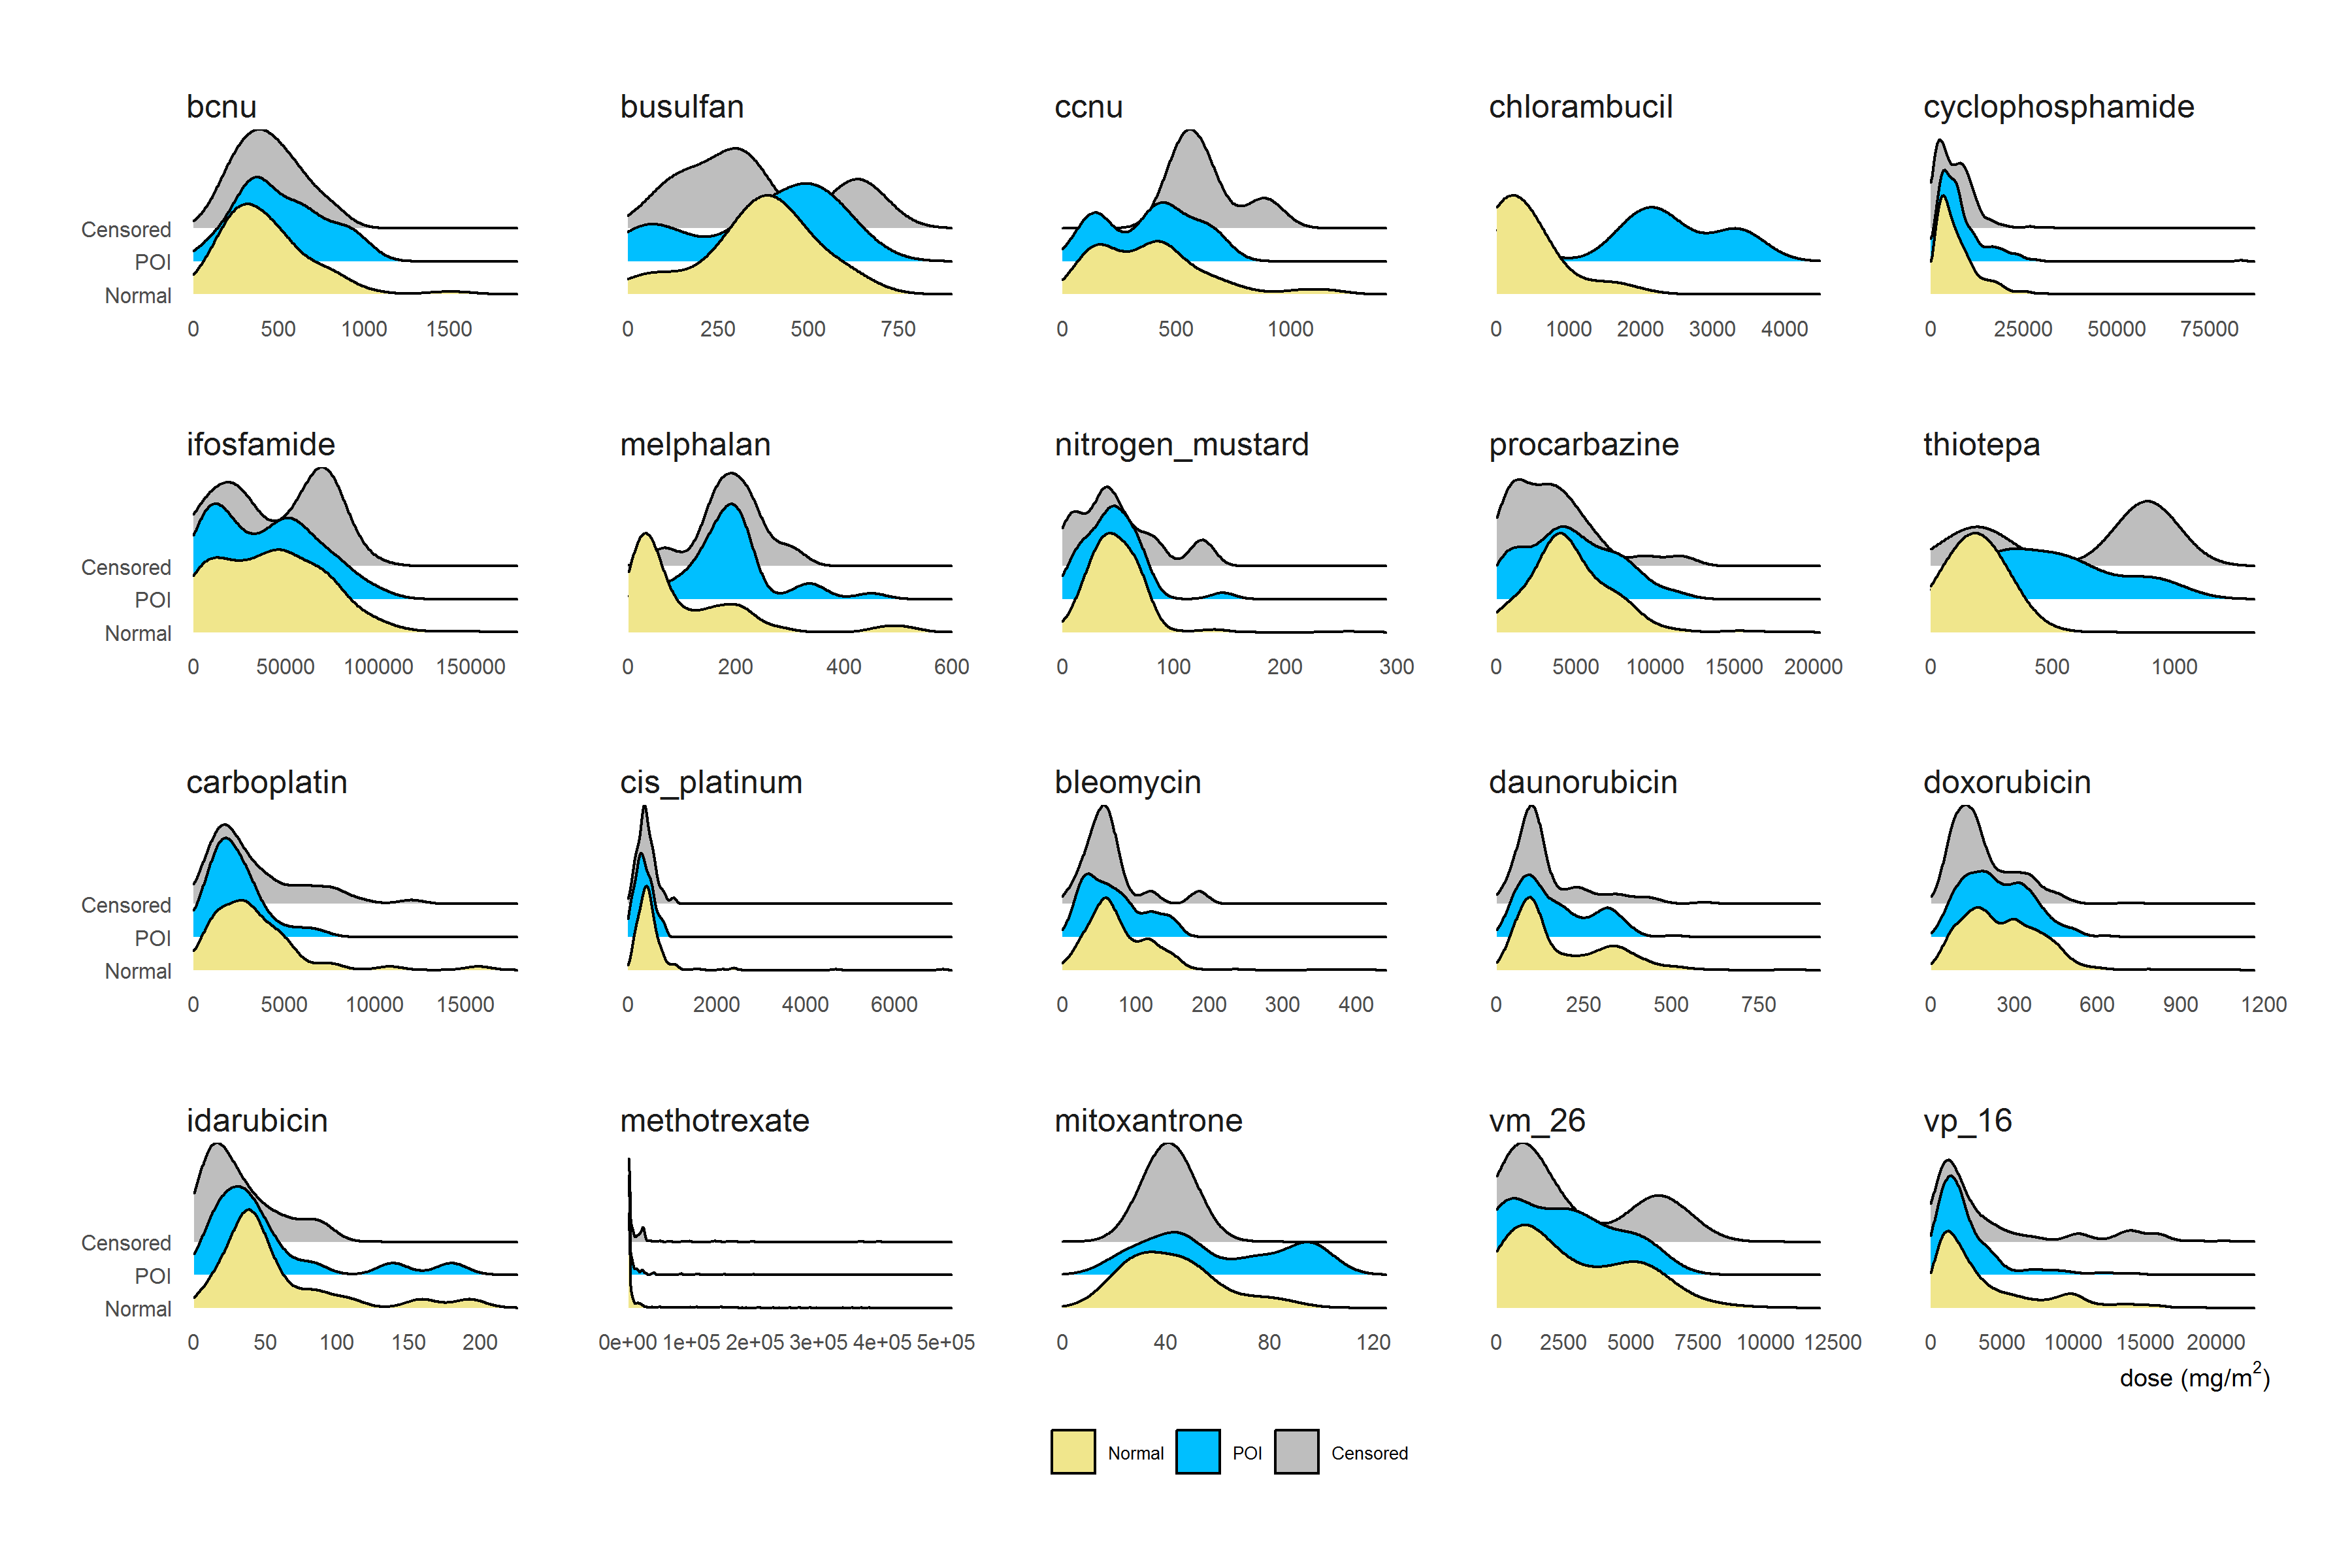
Figure 2.12: Distribution of Chemotherapy dose (>0) categorized by ovarian status at age 25
2.7.5 BMT
Table 2.6 showed the percentages of BMT categorized by ovarian status at age 25. A higher proportion (50.4%) of survivors who experienced BMT developed POI comparing to those who did not experience BMT (6.9%), suggesting BMT was an important risk factor for POI.
| NORMAL n(%) | POI n(%) | SPM n(%) | CENSORED n(%) | |
|---|---|---|---|---|
| No | 5371(77.9) | 475(6.9) | 22(0.3) | 1023(14.8) |
| Yes | 113(33.9) | 170(51.1) | 0(0) | 50(15) |
| MISSING | 484(79.3) | 58(9.5) | 1(0.2) | 67(11) |
| TOTAL | 5968(76.2) | 703(9) | 23(0.3) | 1140(14.6) |
Total body irradiation (TBI), one of the conditioning regimens given before bone marrow transplantation, was identified as an important risk factor for premature ovarian failure (Critchley and Wallace 2005).
Table 2.7 showed the frequencies of patients who received TBI categorized by ovarian status at age 25. A higher proportion (59.4%) of survivors who received TBI developed POI compared to those who did not receive TBI (7.7%), suggesting BMT was an important risk factor of POI.
| NORMAL n(%) | POI n(%) | SPM n(%) | CENSORED n(%) | |
|---|---|---|---|---|
| NO | 5427(77.1) | 541(7.7) | 22(0.3) | 1049(14.9) |
| YES | 50(30.7) | 95(58.3) | 0(0) | 18(11) |
| MISSING | 491(77.7) | 67(10.6) | 1(0.2) | 73(11.6) |
| TOTAL | 5968(76.2) | 703(9) | 23(0.3) | 1140(14.6) |
Figure 2.13 showed the density curves for TBI doses (only doses > 0) categorized by ovarian status at age 25 (density curves for SPM were not plotted as SPM has only 23 observations). Visually, the three curves had similar distributions, although the peak in POI was at a slightly higher dose compared to the peak in Normal.
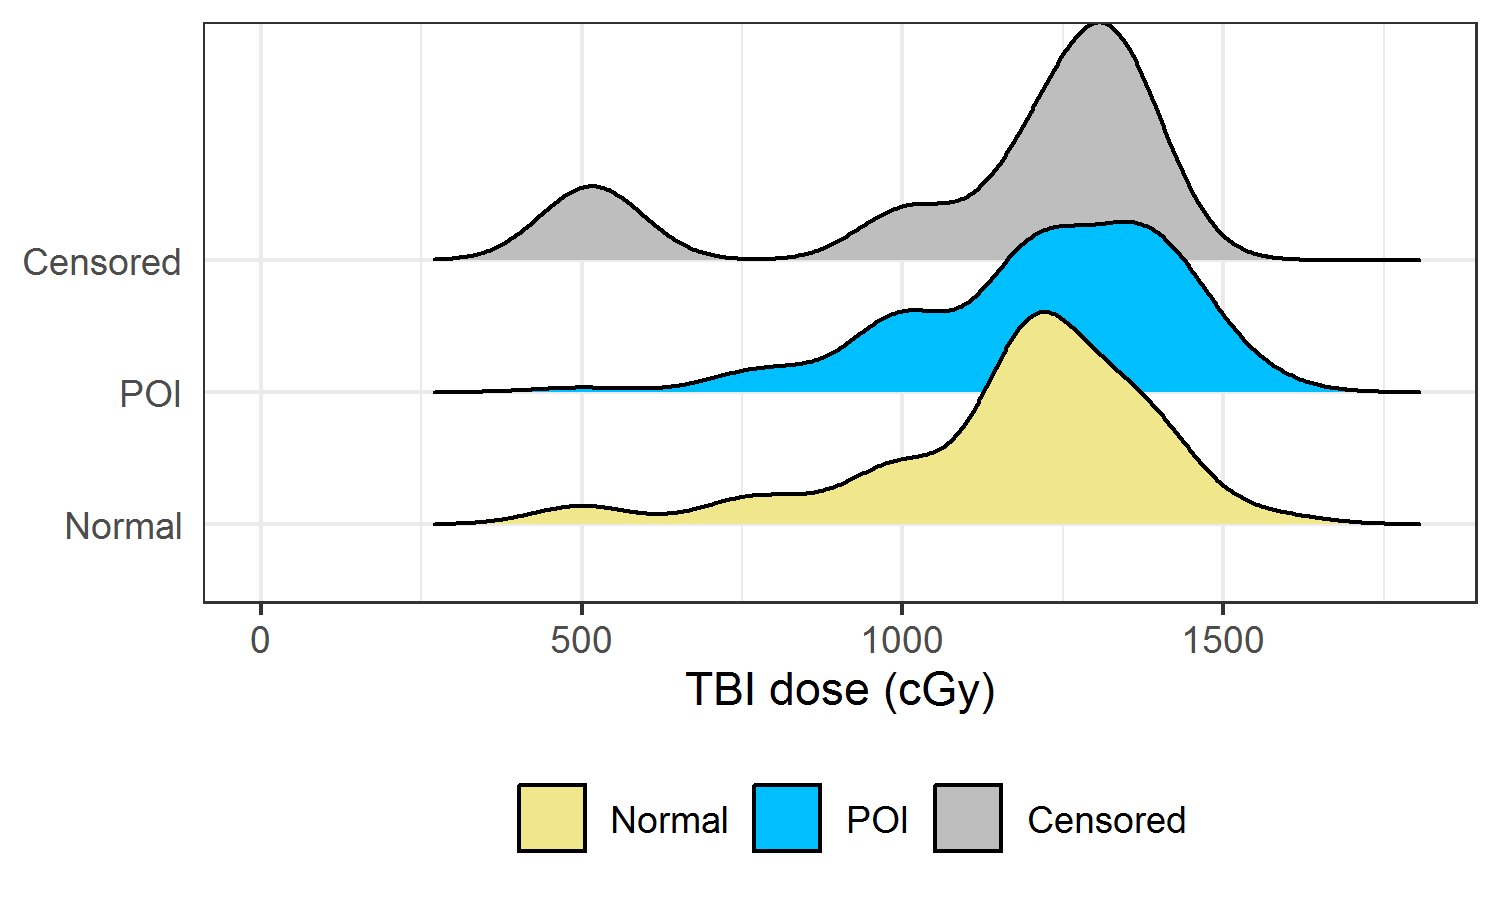
Figure 2.13: Density curve of TBI dose (> 0) categorized by ovarian status at age 25
2.7.6 Diagnosis
Table 2.8 showed the distribution of eight cancer diagnosis categories by ovarian status at age 25. Compared to leukemia which had a similar POI proportion to the overall POI proportion, neuroblastoma, kidney tumors, Hodgkin lymphoma, and soft tissue sarcoma had a higher proportion of POI, while bone cancer, CNS, and non-Hodgkin lymphoma had a lower proportion of POI.
| NORMAL n(%) | POI n(%) | SPM n(%) | CENSORED n(%) | |
|---|---|---|---|---|
| LEUKEMIA | 1964(76.4) | 234(9.1) | 4(0.2) | 370(14.4) |
| NEUROBLASTOMA | 391(61.1) | 63(9.8) | 1(0.2) | 185(28.9) |
| KIDNEY TUMORS | 593(63.5) | 91(9.7) | 3(0.3) | 247(26.4) |
| HODGKINS DISEASE | 1035(87.9) | 118(10) | 1(0.1) | 23(2) |
| SOFT TISSUE SARCOMA | 351(78.2) | 59(13.1) | 8(1.8) | 31(6.9) |
| BONE CANCER | 685(88.2) | 42(5.4) | 2(0.3) | 48(6.2) |
| CENTRAL NERVOUS SYSTEM | 530(69.5) | 61(8) | 2(0.3) | 170(22.3) |
| NON-HODGKINS LYMPHOMA | 419(80.3) | 35(6.7) | 2(0.4) | 66(12.6) |
| TOTAL | 5968(76.2) | 703(9) | 23(0.3) | 1140(14.6) |
Figure 2.14 showed the treatment patterns in different cancer diagnosis types. Cancer diagnoses contained information about treatment regimens, and therefore it may be useful to help improve the accuracy of predicting POI.
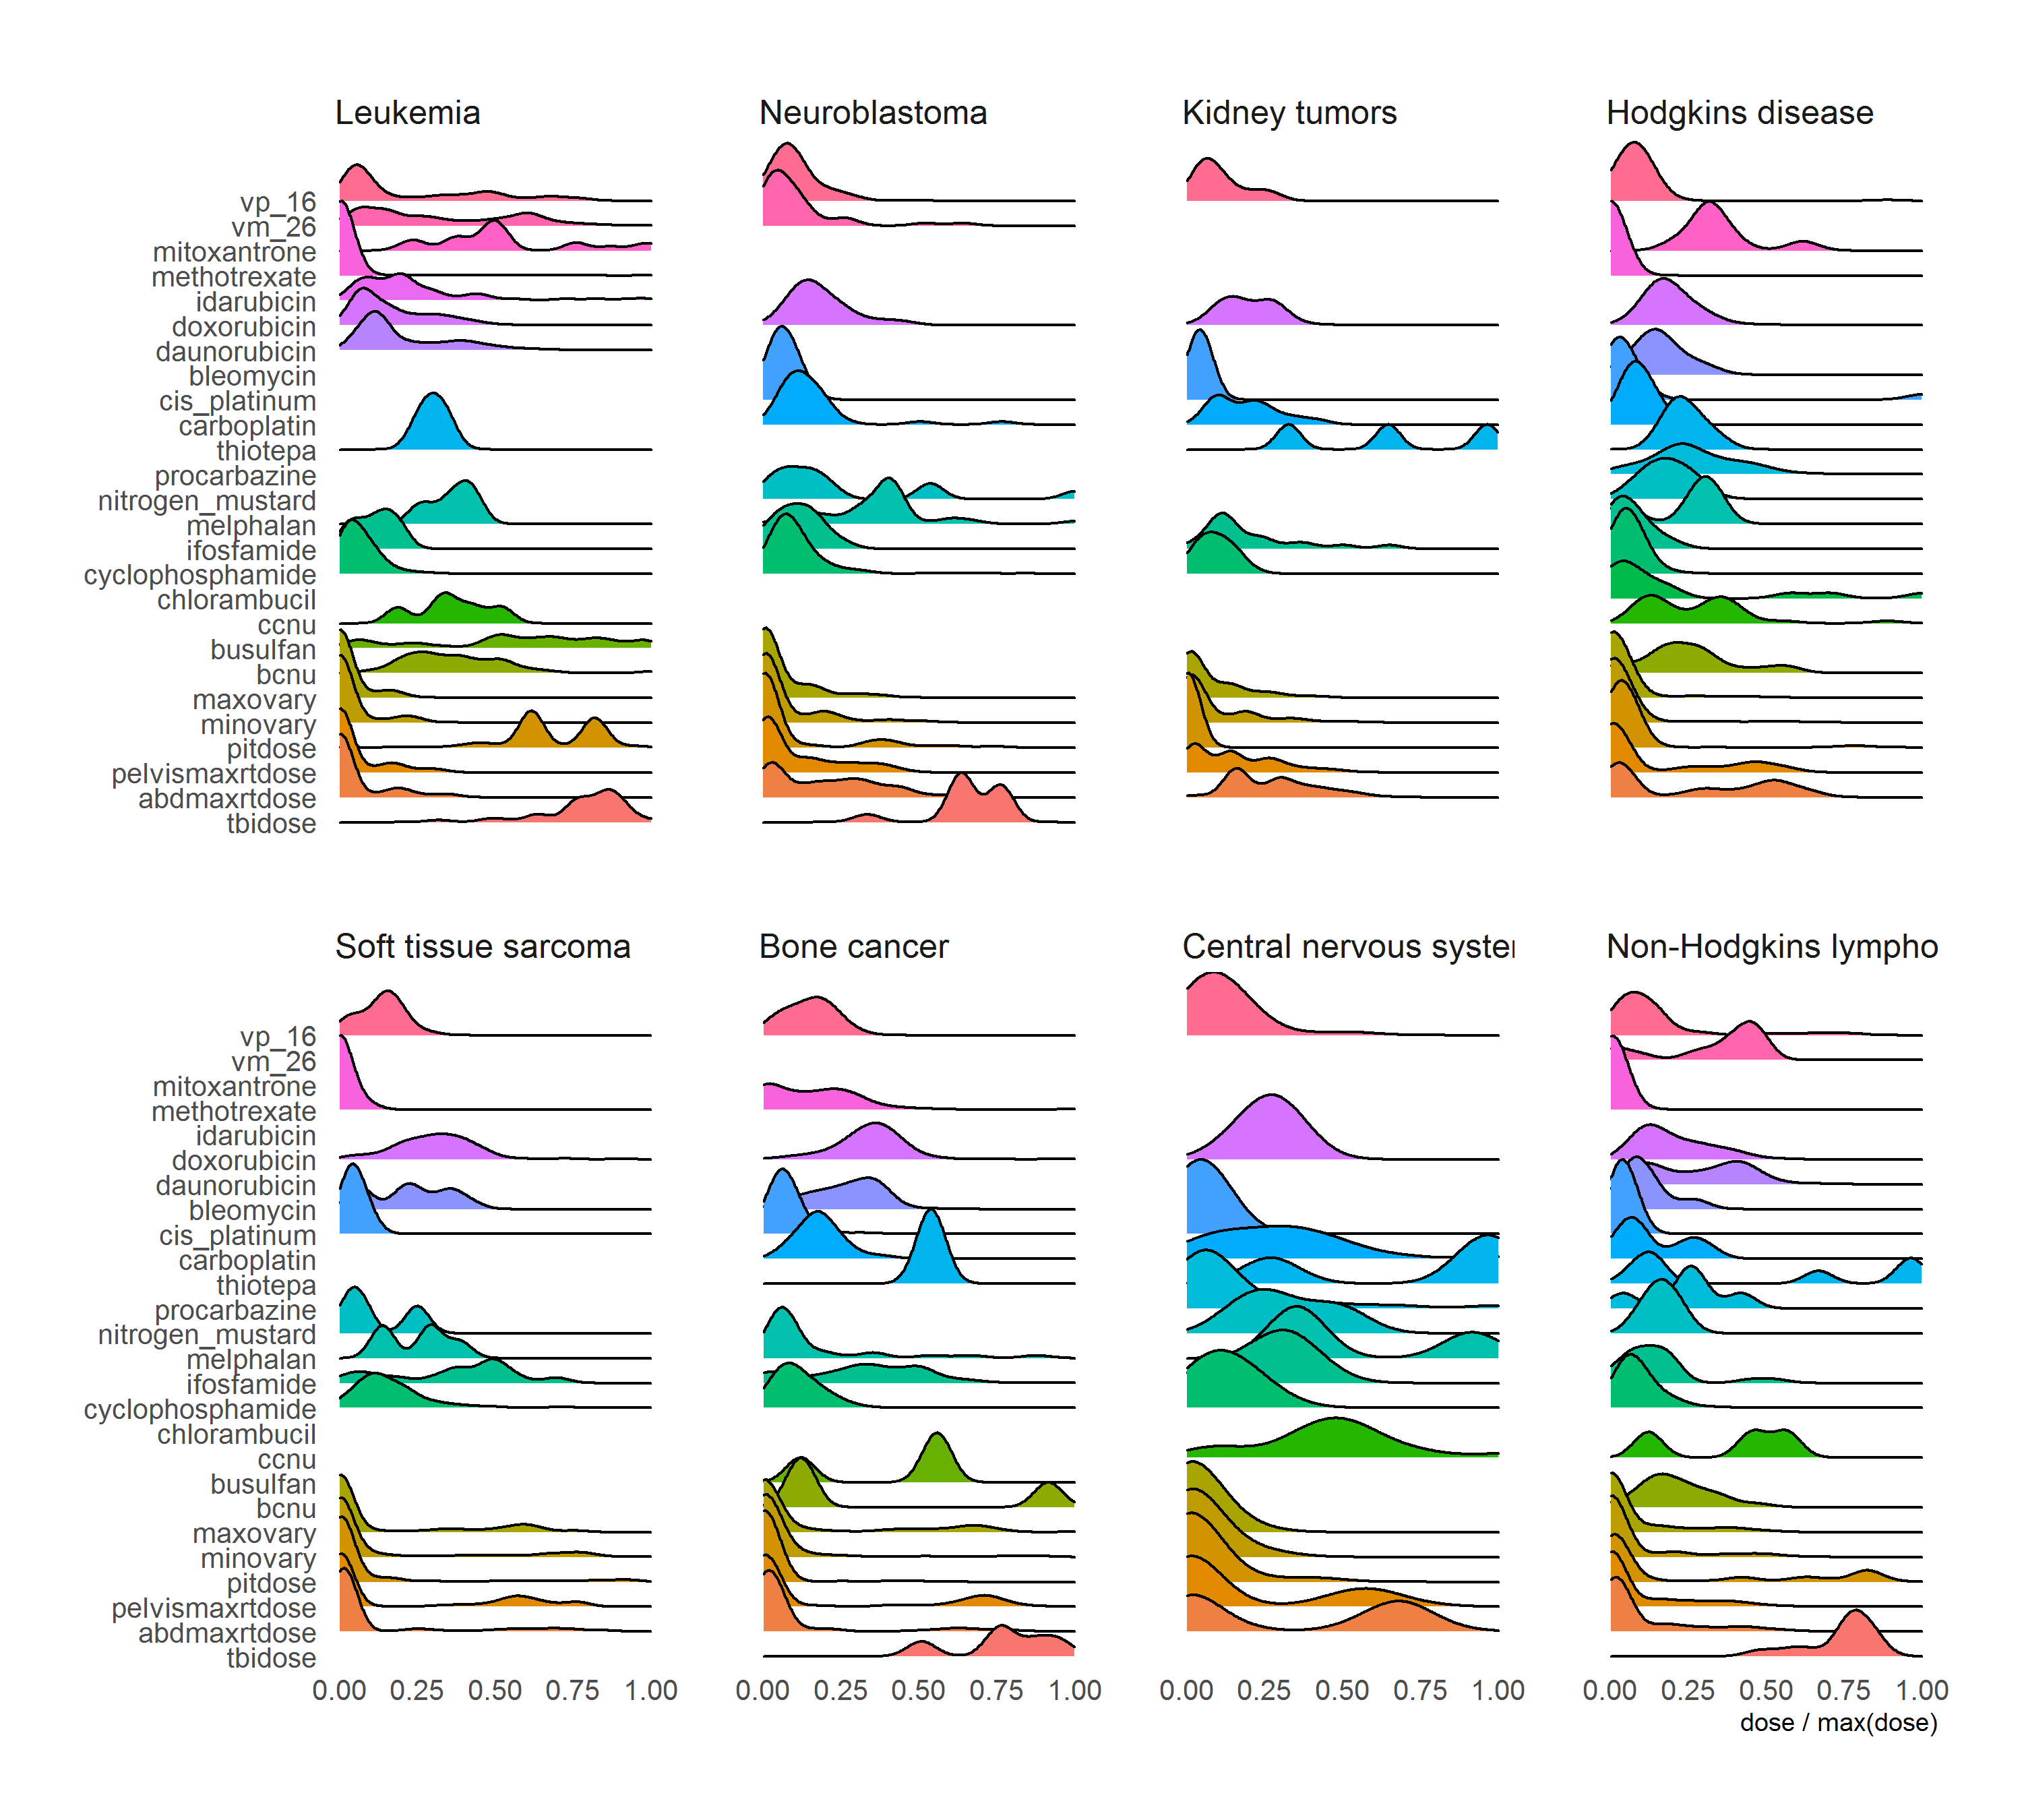
Figure 2.14: Treatment combinations in different cancer diagnosis