I Application of the prediction tool
The relevant treatment information table is provided for input values. The predicted risks of POI from age 21 to 39 are plotted based on the information in the table. Two examples are presented below.
Example 1 (Table B1 and Figure I.1): Suppose one girl (race: white) was diagnosed with Leukemia at age 2. During the cancer treatment, she received radiotherapy including the irradiation to two ovaries and pituitary. The lower cumulative doses received between both side ovaries was 8.1 cGy and the pituitary received 1800 cGy radiation doses. Her chemotherapy included a total cumulative cyclophosphamide dose 13007 \(mg/m^2\), daunorubicin dose 520 \(mg/m^2\), doxorubicin dose 90 \(mg/m^2\), methotrexate dose 460 \(mg/m^2\), and VM 26 dose 6338 \(mg/m^2\).
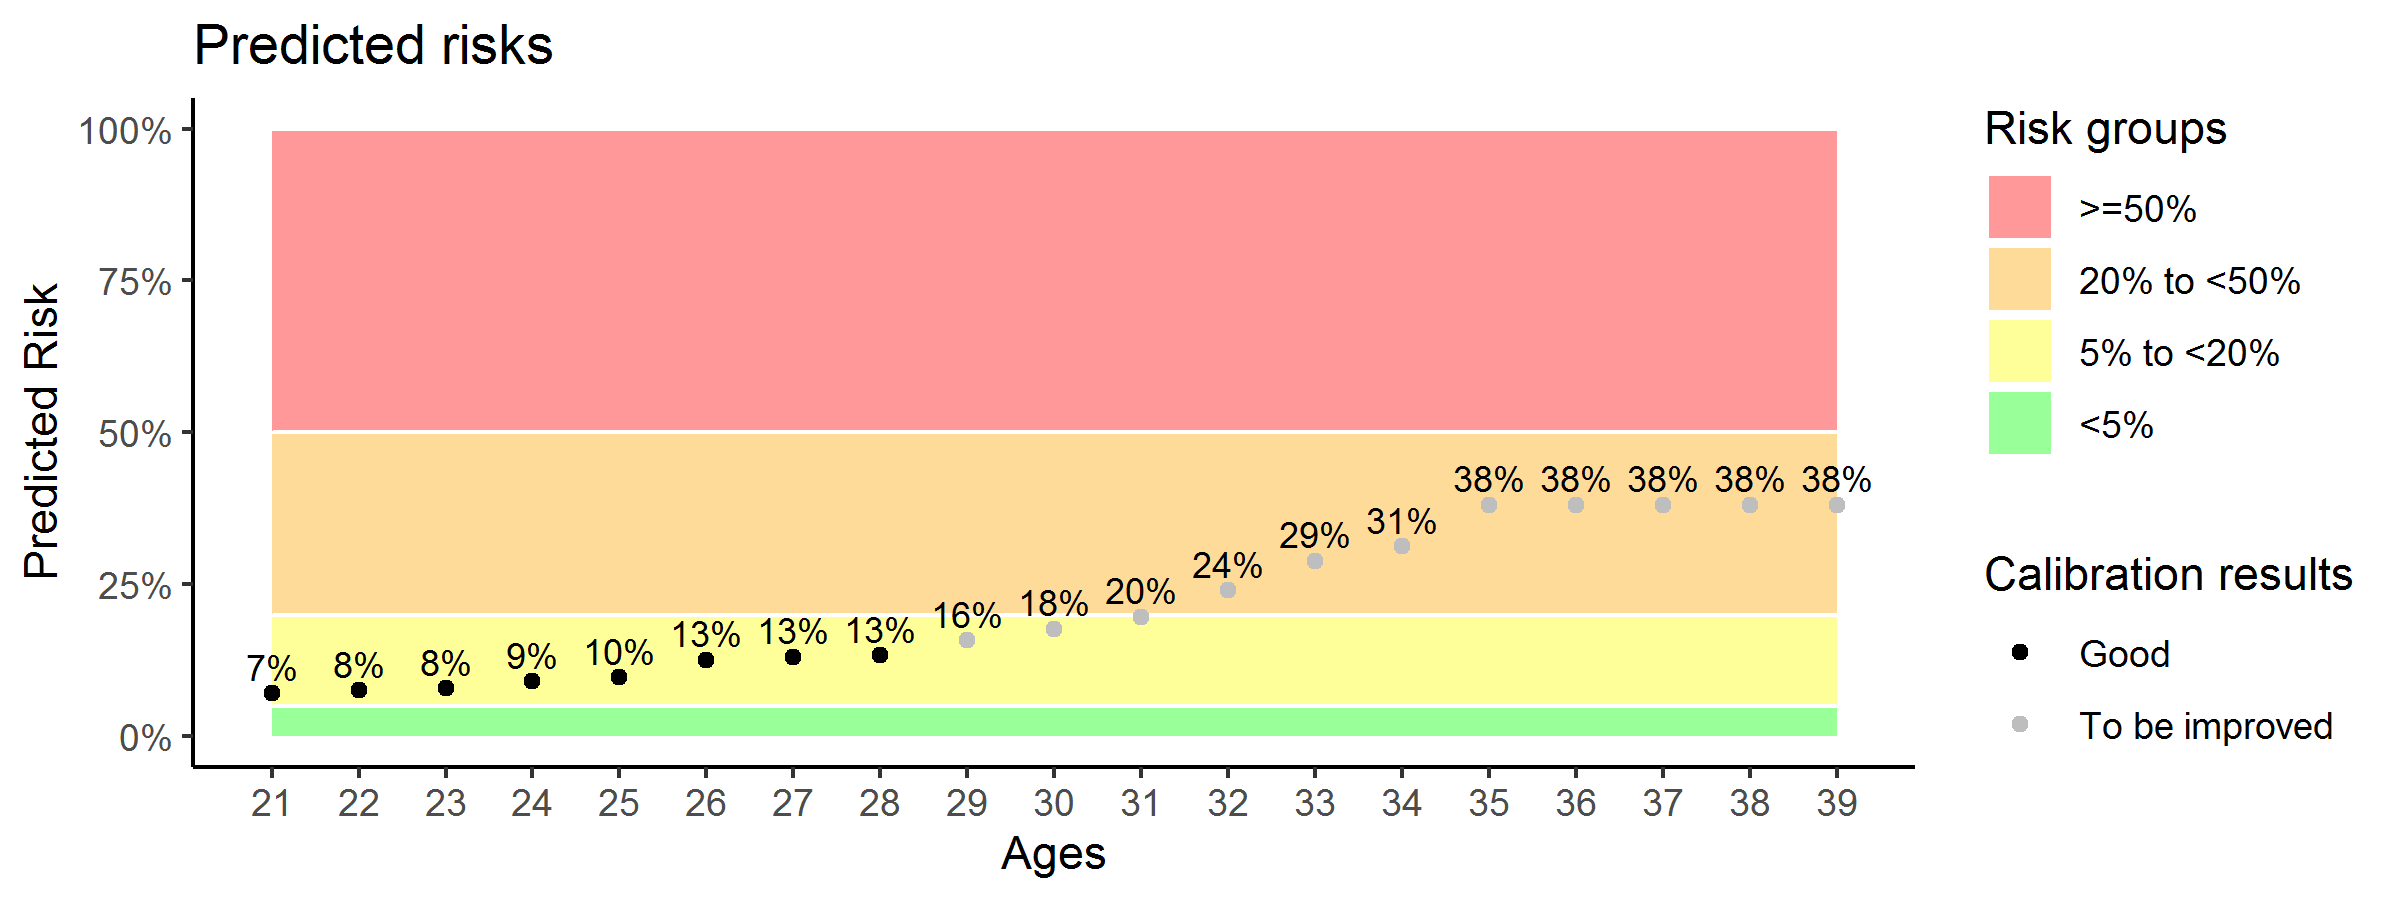
Figure I.1: Predicted risks of POI from age 21 to 39 for Example 1
Example 2 (Table B2 and Figure I.2): Suppose one girl (race: Asian or Pacific Islander) was diagnosed with Non-Hodgkin lymphoma at age 14. During the cancer treatment, she received radiotherapy including the irradiation to two ovaries and pituitary. The lower cumulative doses received between both side ovaries was 2.3 cGy and the pituitary received 47 cGy radiation doses. Her chemotherapy included a total cumulative BCNU 300 \(mg/m^2\), cyclophosphamide dose 15576 \(mg/m^2\), daunorubicin dose 118 \(mg/m^2\), doxorubicin dose 181 \(mg/m^2\), methotrexate dose 7934 \(mg/m^2\), and VP 16 dose 6184 \(mg/m^2\).
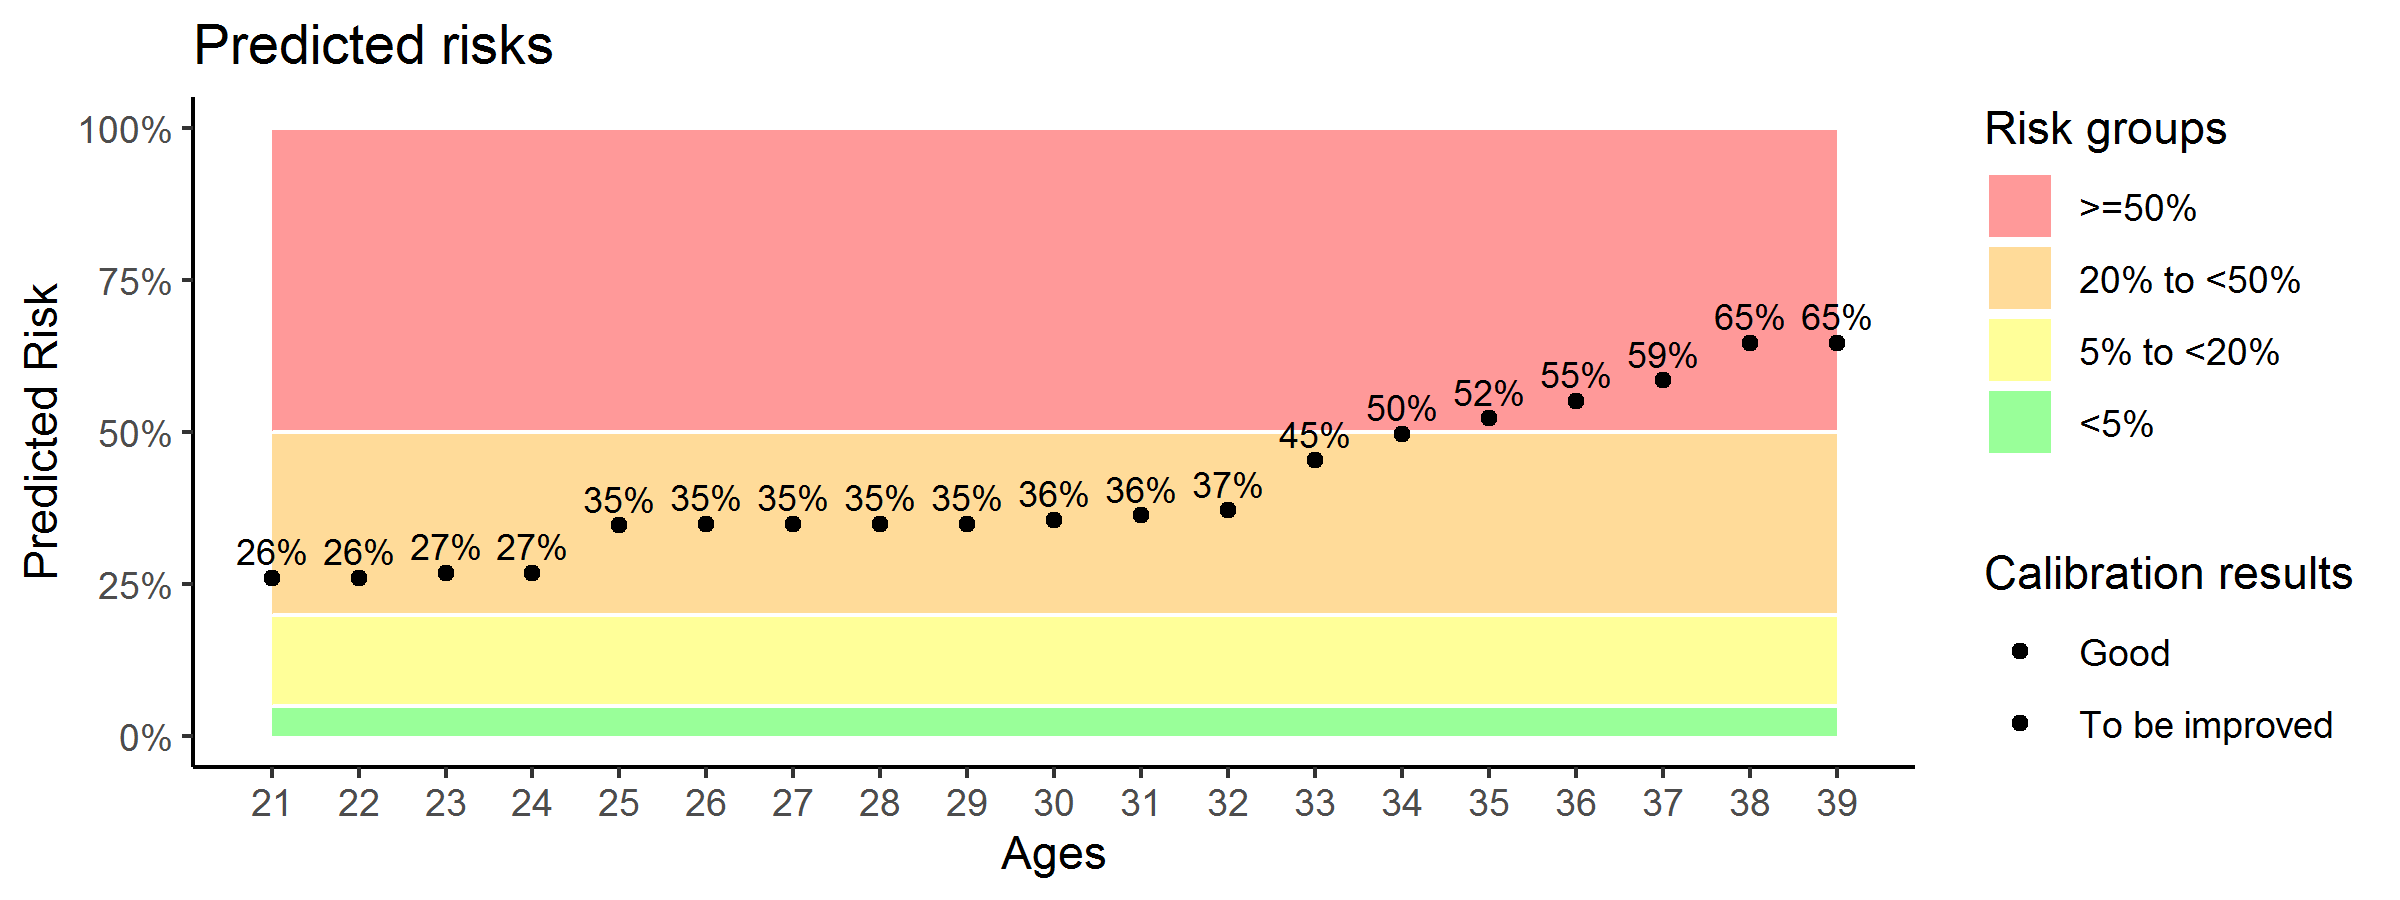
Figure I.2: Predicted risks of POI from age 21 to 39 for Example 2