F Assessment of convergence in MI
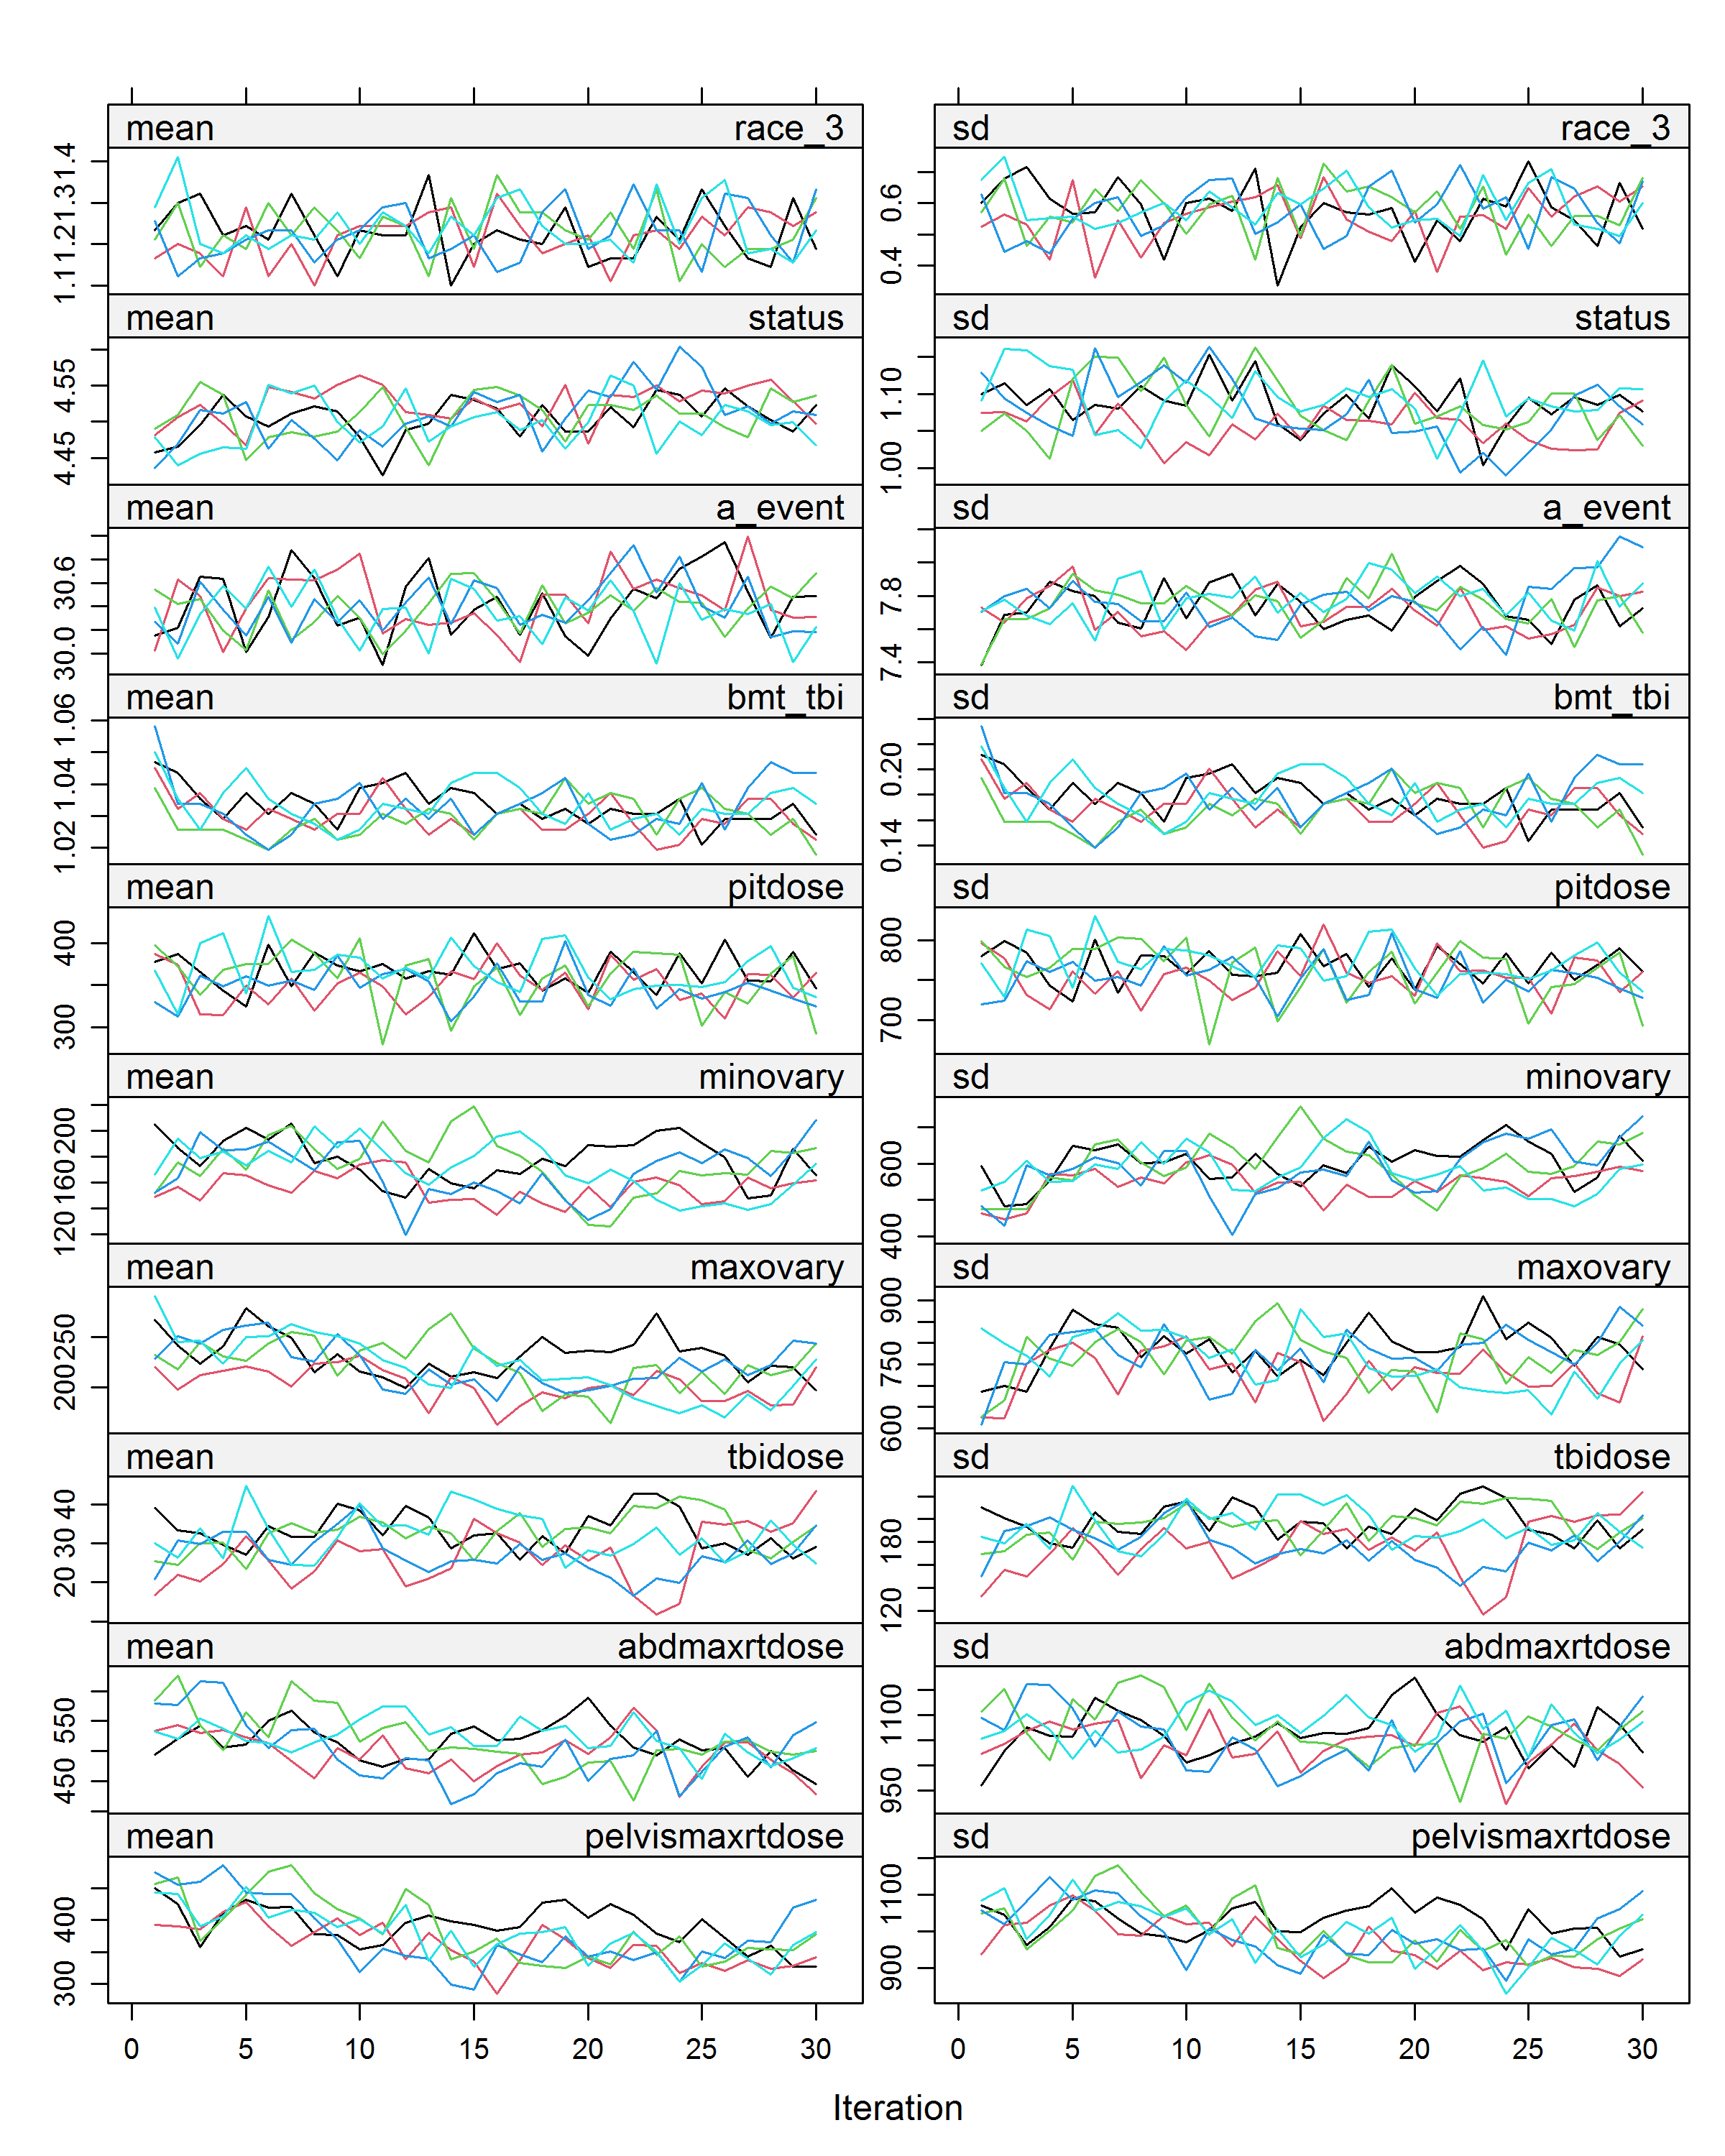
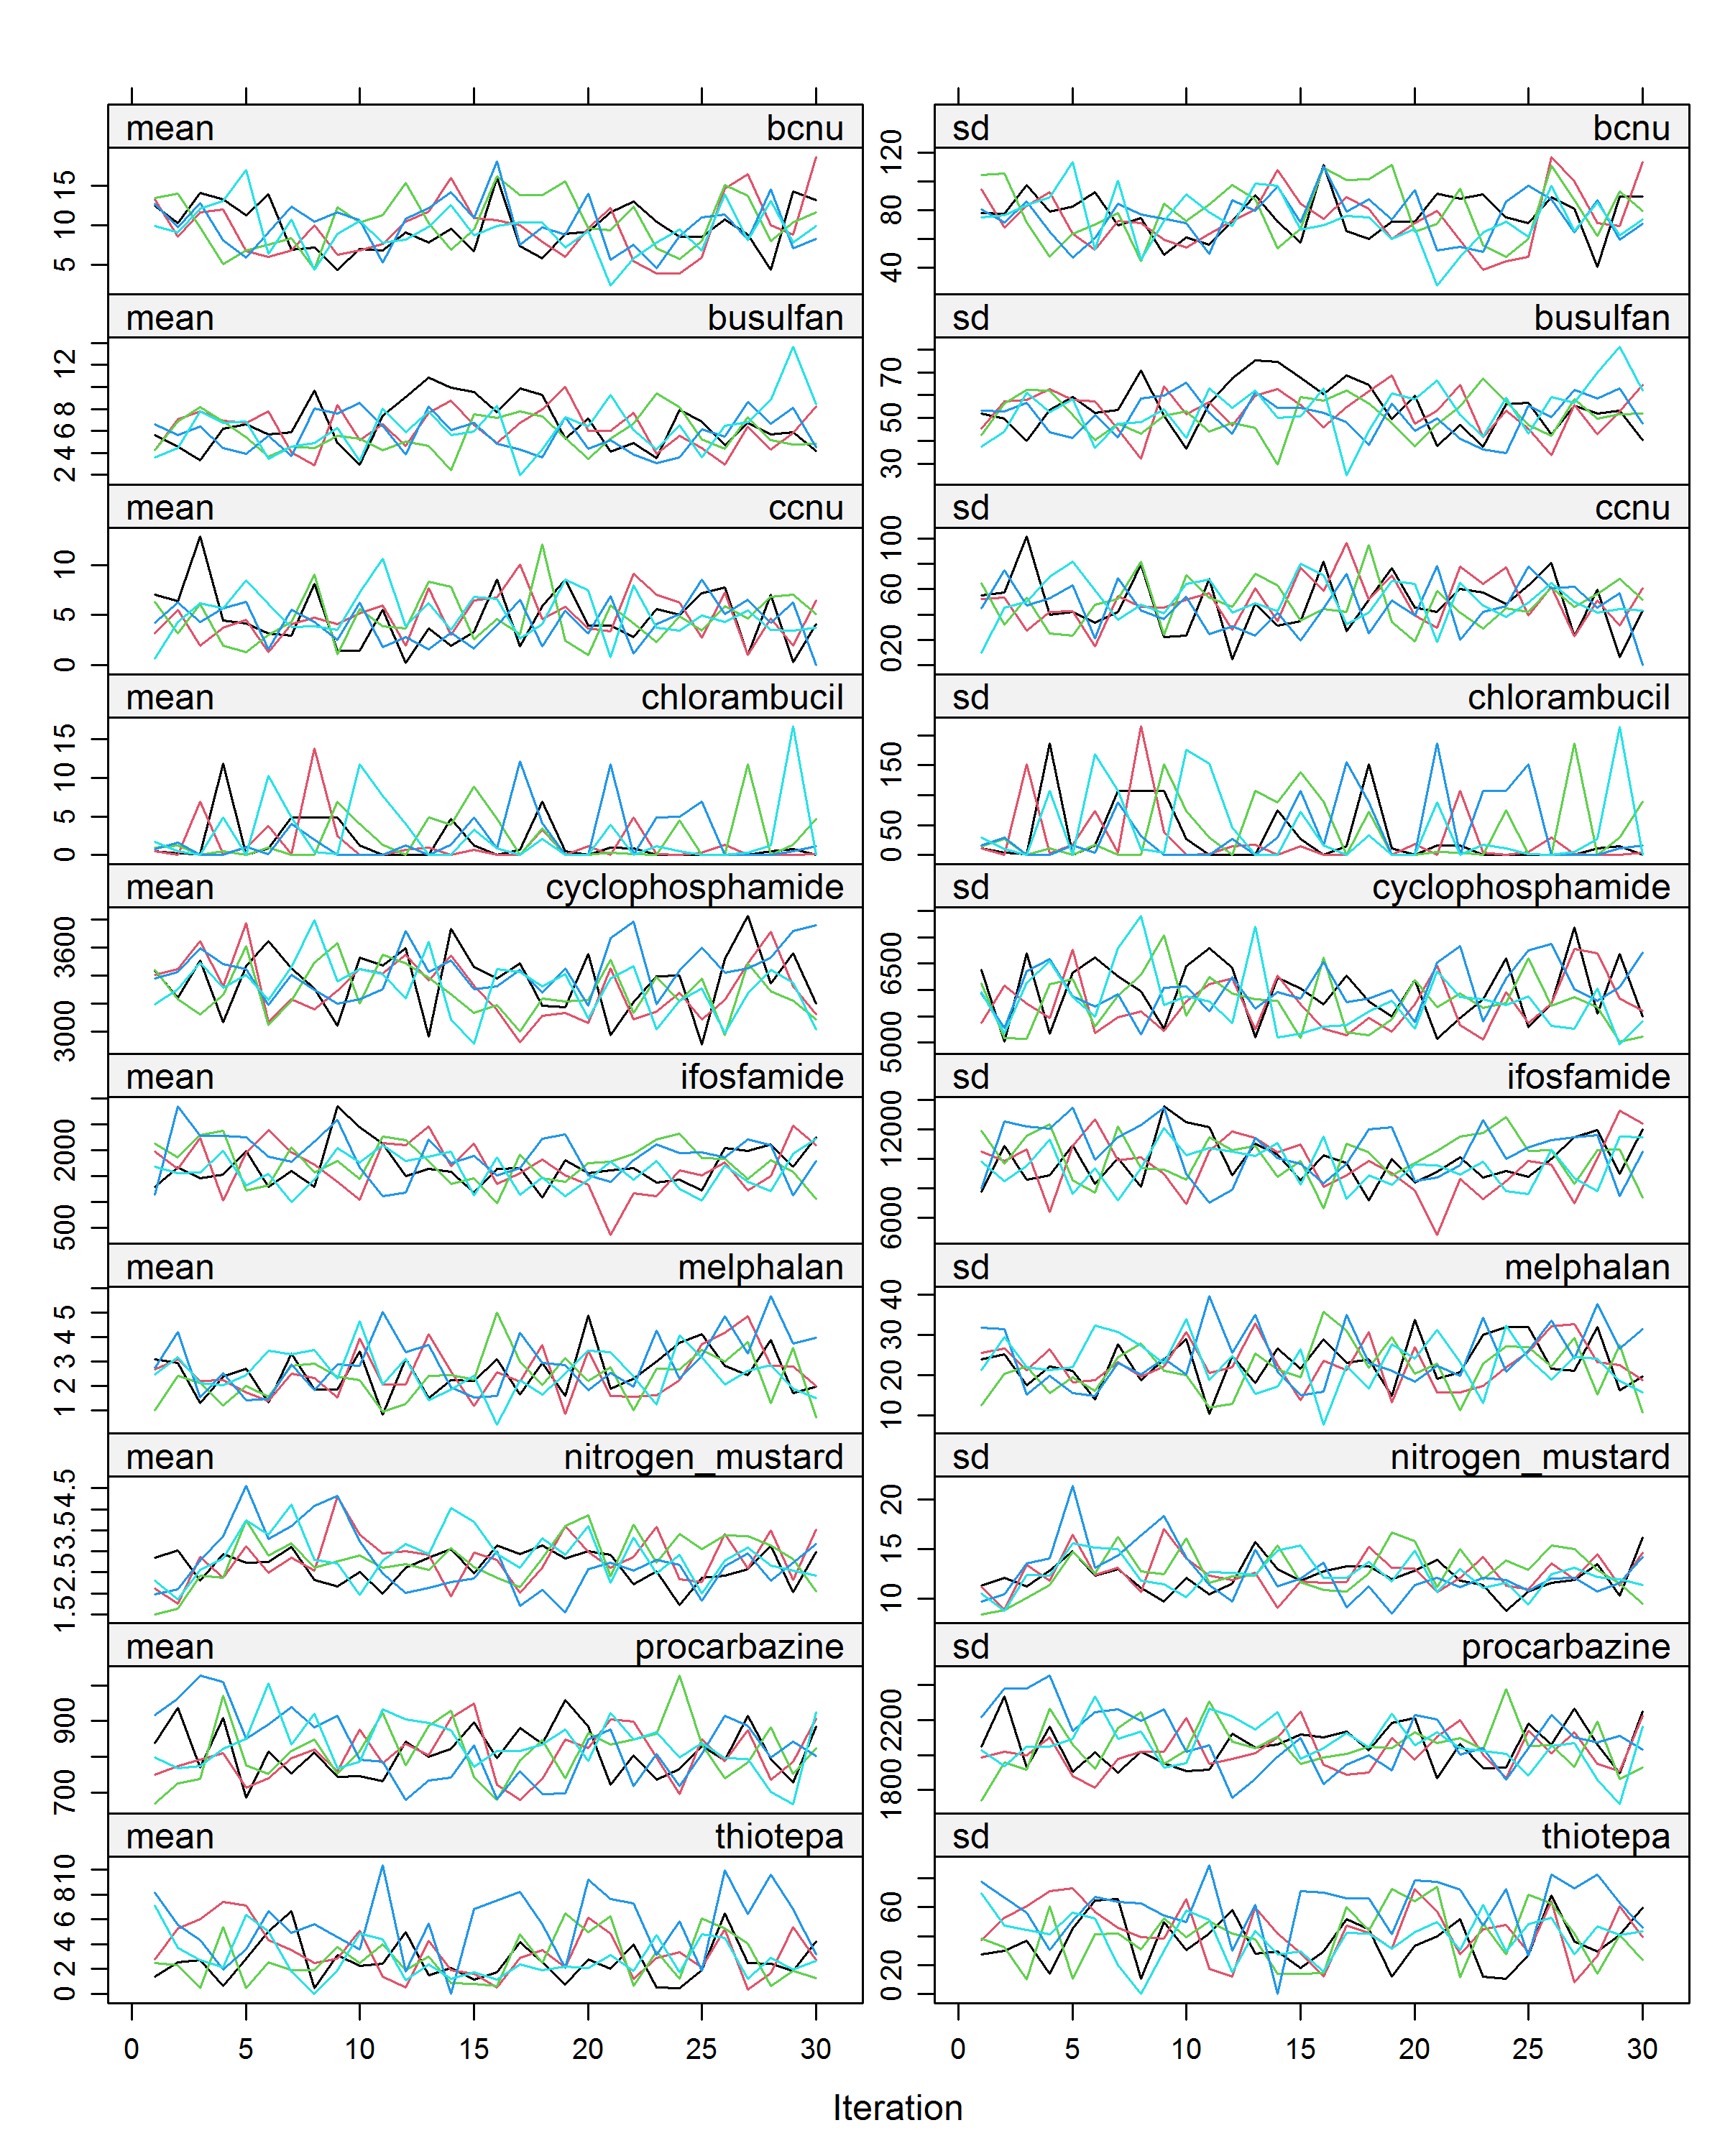
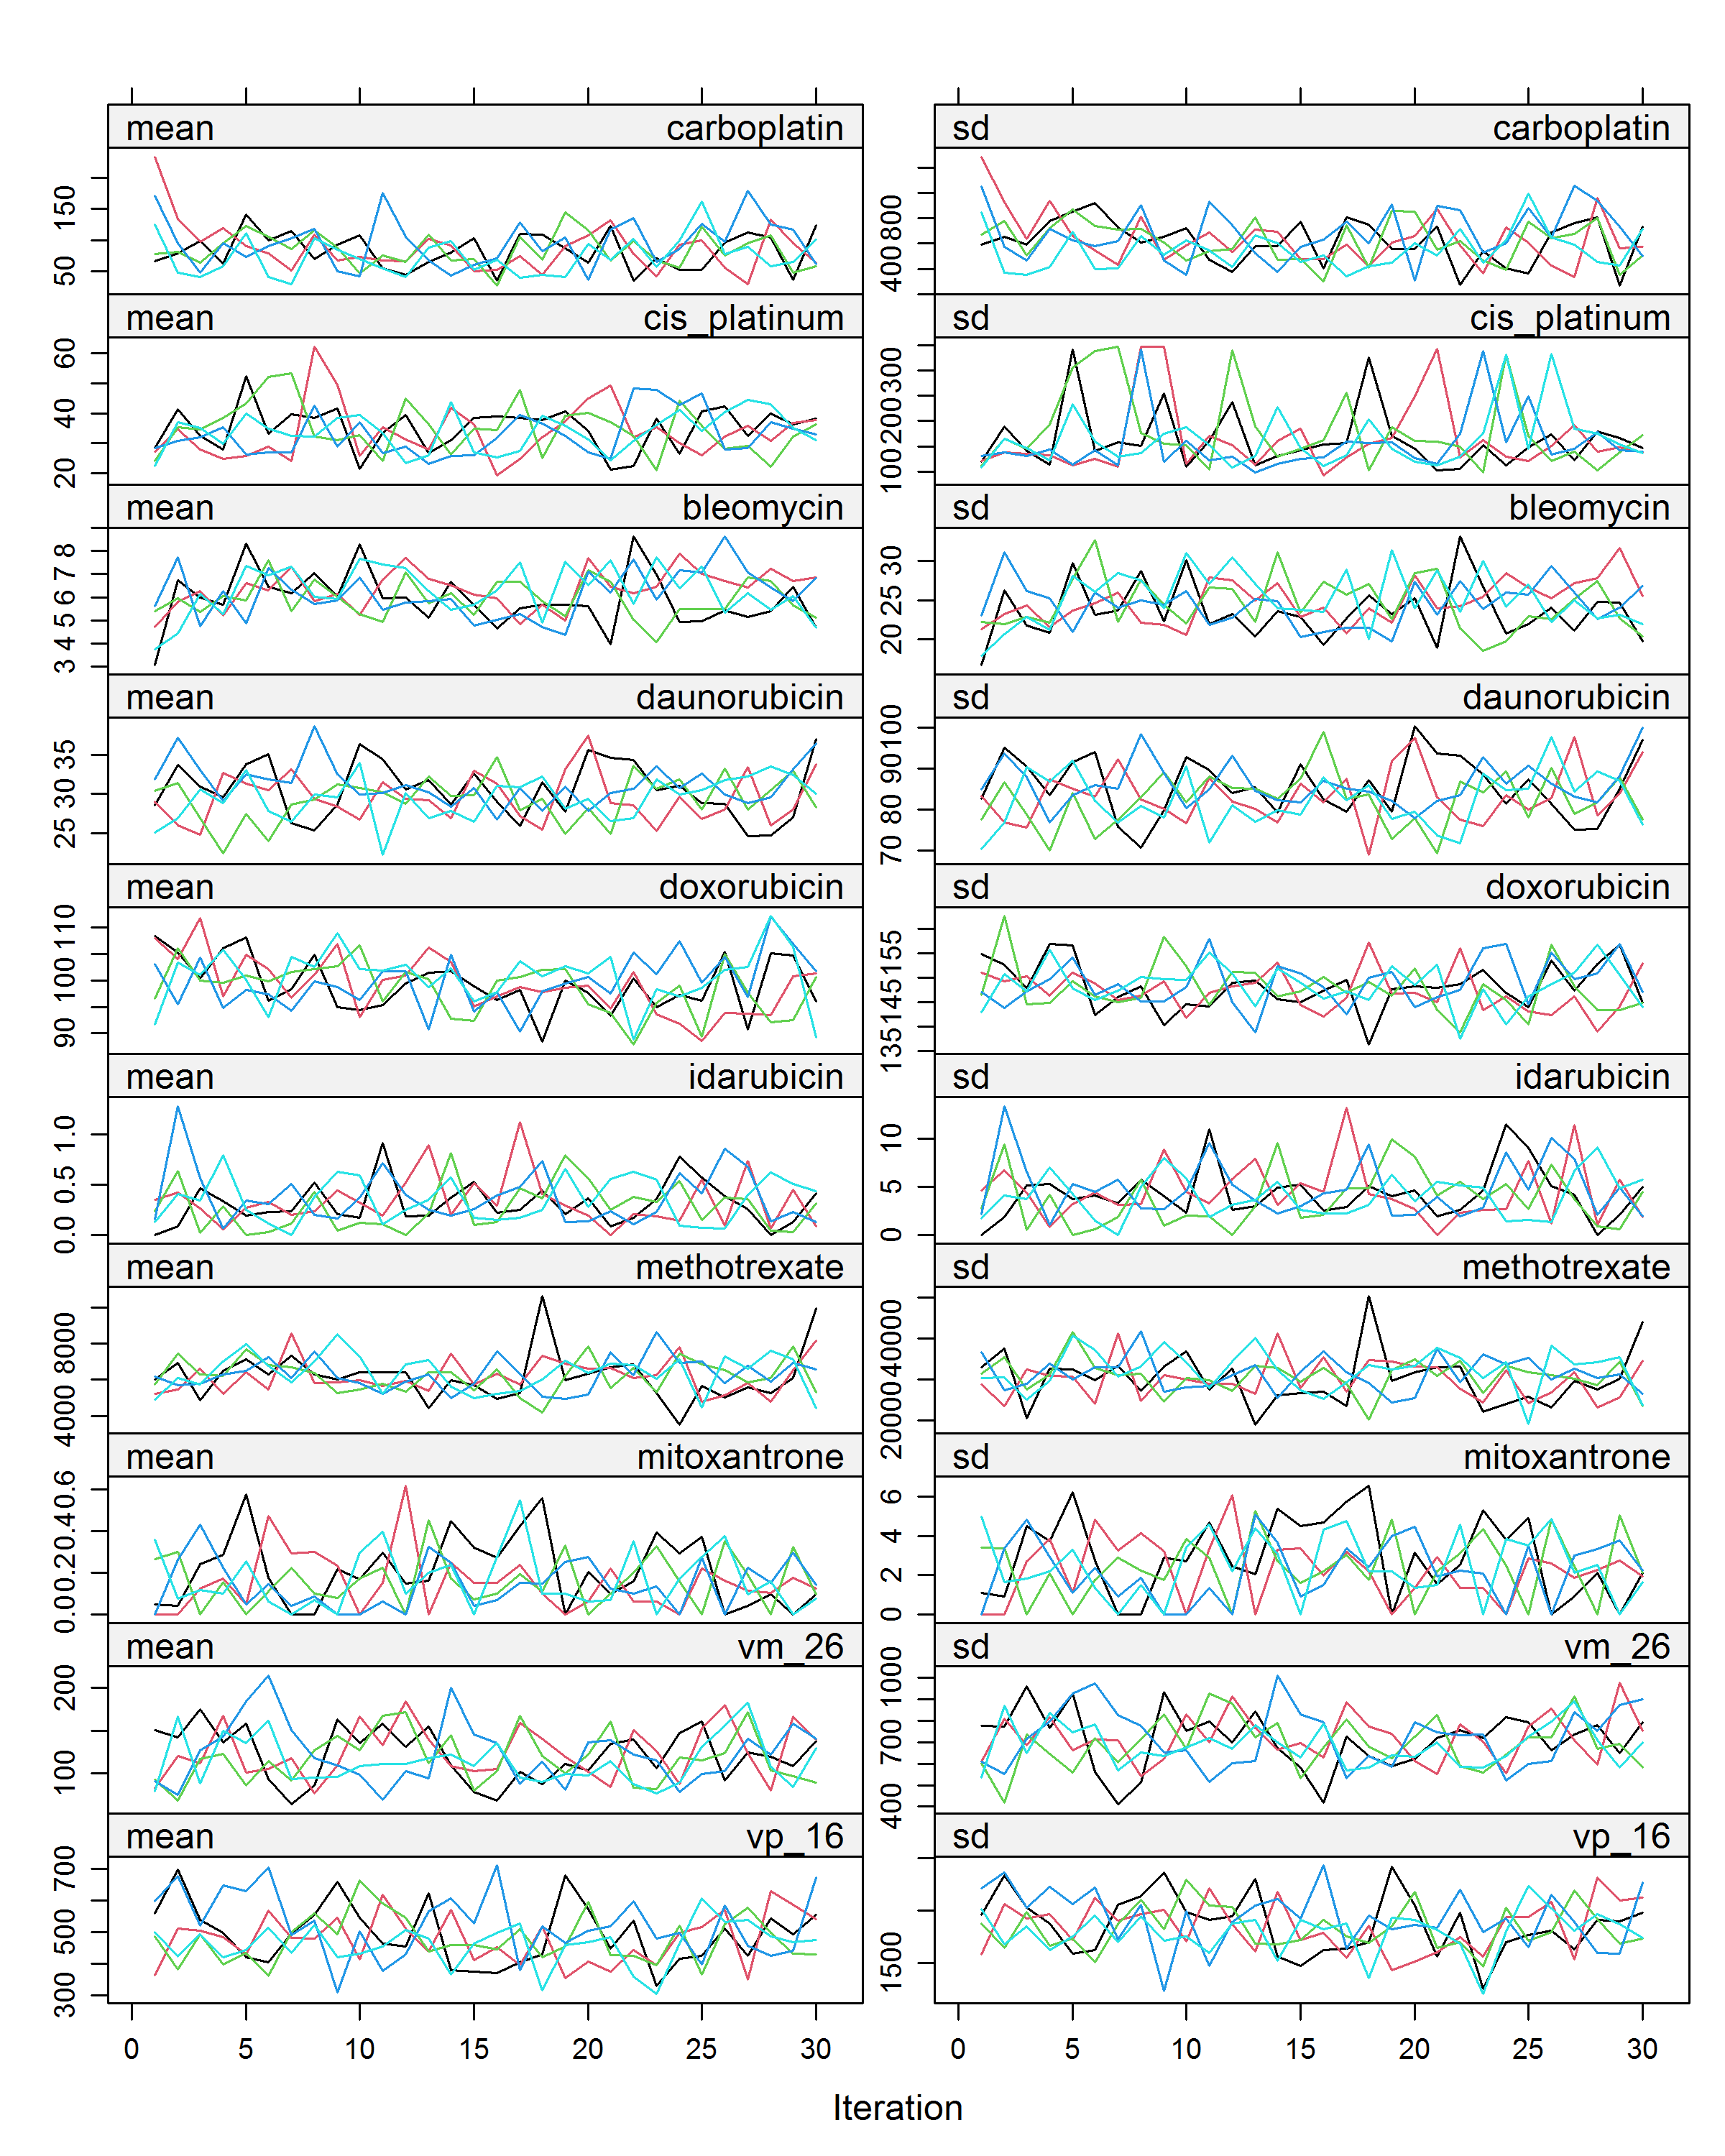
The number of the iteration times was set to 30 to examine the convergence. Figure F.1, Figure F.2, and Figure F.3 visualized the convergence of imputed values for all the variables by plotting the means and standard deviation (SD). There is no convergence issue for any variables. And they attain convergency by 10 iterations.

Figure F.1: Convergence plots for variables: race, age at event, BMT indicator, irradiation dose to pituitary, minimum irradiation dose to ovaries, maximum irradiation dose to ovaries, total body irradiation dose, irradiation dose to abdomen, irradiation dose to pelvis, indicator for receiving radiotherapy

Figure F.2: Convergence plots for doses of 10 chemotherapy agents: bcnu, busulfan, ccnu, chlorambucil, cyclophosphamide, Ifosfamide, melphalan, nitrogen mustard, procarbazine, thiotepa

Figure F.3: Convergence plots for doses of 10 chemotherapy agents: carboplatin, cis platinum, bleomycin, daunorubicin, doxorubicin, idarubcin, methotrexate, mitoxantrone, vm_26, vp_16